Overview of Coral Distributions
Overview of Coral Distributions
Historical Perspective
As with most biogeographic studies, coral biogeography has followed in the wake of taxonomy, the latter having had three very distinct historical phases: (1) museum-based studies of coral collections from early expeditions of discovery, (2) in-situ studies using scuba which led a global unification and (3) molecular studies which are currently offering new insights into species phylogenies (Veron, 2013). The biogeography associated with the first of these phases was, of necessity, confined to the generic level and represented by contour maps (Wells, 1954; Stehli and Wells, 1971; Rosen, 1971; Coudray and Montaggioni, 1982; and Veron, 1986). These maps differ in detail but not in essence; all indicated that the central Indo-Pacific, notably the Great Barrier Reef of Australia, was the global centre of coral diversity. By the early 1990s, developments in coral taxonomy towards a single global coverage allowed these generic distributions to be replaced by species distributions. By that time extensive revisions by several taxonomists using scuba had been completed for the eastern and western coasts of Australia (summarised by Veron, 1993a and Veron and Marsh, 1988 respectively), the Philippines (summarised by Veron and Hodgson, 1989) and Japan (Veron, 1992) as well as global studies of specific taxa including Hoeksema’s (1989) revision of the Fungiidae. Biogeographic aspects of these revisions were then integrated with a somewhat patchy coverage of other Indo-Pacific studies by Veron (1993a), a step that initiated the development of Coral Geographic as a global electronic database. The taxonomy and distribution patterns of Caribbean corals are relatively straightforward.
Species-level diversity data from Coral Geographic were first published by Veron (1995), a study essentially affirming the overall diversity pattern of previous publications but with one major exception; it showed that the Great Barrier Reef was, in fact, not part of the global centre of diversity as earlier publications indicated. This finding created widespread consternation among conservation agencies because the Great Barrier Reef, by then given World Heritage status and managed by a major Australian Government agency, had long been assumed to offer permanent protection for the world’s centre of coral diversity. The alternative that this study indicated was that few of the world’s mega-diverse reefs occurred within a marine park and none had any effective protection. Worse, these reefs were believed to be confined to the Indonesian-Philippines archipelago, a region characterised by high population pressures and a record of reef exploitation. It is well-known history that these concerns soon precipitated one of the biggest information quests in the history of marine biology – to delineate the global centre of coral diversity, a region that became known as the ‘Coral Triangle’.
By this time, a single broadly cohesive coral taxonomy had become firmly established and well-supported species-level distribution maps were generated by Coral Geographic (in Veron, 2000a). In consequence, these volumes combined with an electronic identification guide (Veron and Stafford-Smith, 2002) gave impetus to field studies throughout the Indo-Pacific, a movement strongly promoted by increasing awareness that mass bleaching events were seriously impacting coral reefs (Glynn, 1984, 1991; Brown, 1997; Hoegh-Guldberg, 1999; Berkelmans and Oliver, 1999 and others).
Importantly as far as the Coral Triangle was concerned, the quest for its delineation revealed that the centre of coral diversity was not just the Indonesian-Philippines archipelago, but that the centre extended east to the reefs of eastern Papua New Guinea and the Solomon Islands.
Political response to the final delineating of the Coral Triangle was prompt. In September 2007, twenty-one world leaders attending the Asia Pacific Economic Cooperation (APEC) summit in Sydney recommended the establishment of the Coral Triangle Initiative, a move endorsed by the Indonesian Government and launched at the United Nations Framework Convention on Climate Change, Bali in December of that year (Veron et al., 2009). Up to and since that time there have been many scientific publications and several popular books about the Coral Triangle (in Hoegh-Guldberg et al., 2009), deeply entrenching its position not only as the global centre of coral diversity but as the centre of diversity of most major groups of tropical marine taxa, a fact earlier elucidated by our colleague Gerald Allen from his extensive studies of coral reef fishes.
Curiously, despite the extraordinary level of scientific, political and popular interest about the Coral Triangle, the detailed data by which it was delineated has not been published. This is largely because the volume of information needed to do so necessitated an electronic medium, a need only now being met by Coral Geographic. Nevertheless, this article has a broader objective, which is to provide a definitive description of fundamental global patterns of coral distributions and diversity worldwide.
In so doing, it cannot be overstressed that corals are under enormous threat from climate change with the horrific prognosis that reefs, and the corals that build them, will progressively deteriorate during this century with the real possibility of Scleractinia facing partial or total extinction (Guinotte et al., 2003; Hoegh-Guldberg et al., 2007, 2009; Baker et al., 2008; Veron, 2008; Carpenter et al., 2008; Veron et al., 2009 and others). This overview is not intended to address this deterioration nor review future prognoses, but rather to provide a biogeographic template for investigating the process.
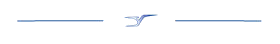
The organisational basis of Coral Geographic is 150 ecoregions, an effective methodology (Green and Mous, 2008; Spalding et al., 2007) where each ecoregion has a known internal consistency and significant external differences from other ecoregions. This system, with periodic refinement, was initiated in 1997 and has been the source of extensive mapping of coral distribution and diversity ever since.
Ecoregions of corals used in the present study. Ecoregions of the Coral Triangle generally accord with Green and Mous (2008).Figure 1.

Methods
Comprehensive accounts of Indo-Pacific species distributions require extensive taxonomic knowledge as well as time and funding. Field work by the present authors has taken more than 120 expeditions and over 20 person-years of expert effort. Even so, this level of commitment has resulted in comprehensive coverage of only about half the world’s coral ecoregions - thus our data have been extensively augmented by the array of information sources as follows.
Data Sources
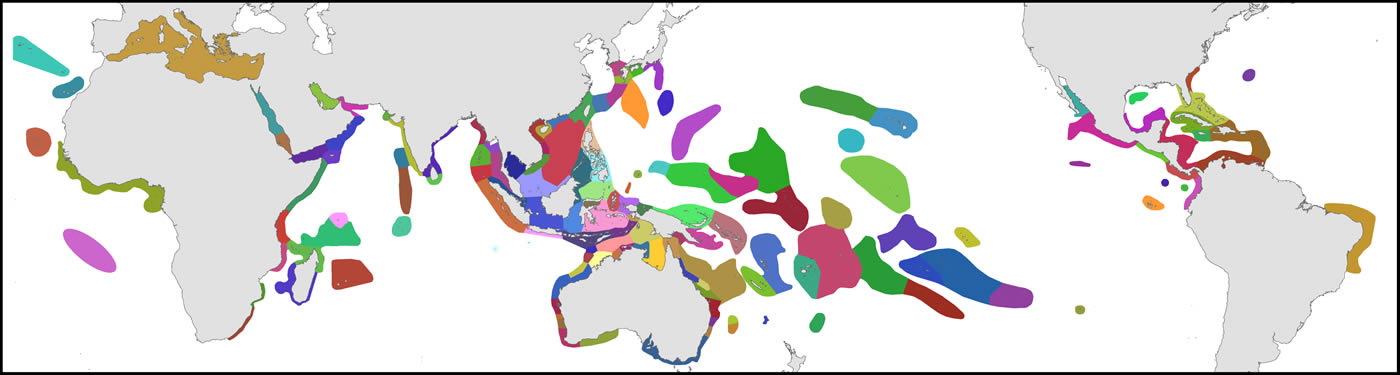
1. Original fieldwork. The geographic coverage of studies undertaken by the authors are indicated in dark green in the accompanying map and itemised at the end of this article. This currently includes (a) comprehensive studies of more than 4500 stations in 50 ecoregions, (b) incomplete field studies targeting specific taxa of more than 250 stations in 18 ecoregions and (c) transitory field observations of around 190 stations in 13 ecoregions. This fieldwork was sometimes undertaken concurrently by one of us with our associates on the same expedition and sometimes on different expeditions as time and opportunity allowed. In total, our coverage involved morethan 5000 stations in 85 of the world’s 150 ecoregions after separate studies in the same ecoregion are combined.
Distribution of original studies by the authors. Dark green = detailed original field studies leading to species inventories, including extensive comparison with local collections; pale green = original but incomplete field studies, mostly of specific taxa, augmented by studies of collections across all available taxa; blue = studies of collections; pink = unstudied ecoregions (but may include occasional specimens available from other collections). Figure 2.
Each station typically involved between 1 and 5 scuba dives depending on the nature and extent of the work being undertaken. Where available, local knowledge and/or satellite imagery were used to select sites of greatest diversity in unfamiliar ecoregions and additional stations were then selected to include habitats with different substrate types, depth, current regimes and levels of exposure to wave action. With rare exception, fieldwork was undertaken via expeditions specifically dedicated to taxonomic and abundance studies. Importantly, inter-observer taxonomic issues were minimised through shared fieldwork and extensive checking of specimens and underwater photographs.
2. Taxonomic literature. Most monographs stemming from early expeditions of discovery provide little insight into coral distributions, however many that pre-date the age of in situ studies do, especially those linked to the generic-level biogeographic publications noted above. Most taxonomic publications subsequent to that time provide geographic records and in total over 1000 taxonomic publications contribute to the Coral Geographic database.
3. Biogeographic literature. This is smaller in terms of number of publications and is variable in quality. In principal, species names in any biogeographic publication are only useful if they can be associated with entities that are recognisable in the field. Species which are not recognisable (unstudied ‘nominal’ species) are not included in this study, nor are unverified records used which cannot be attributed to a recognisable species. Those not included have either been superseded, include species that are already recorded by listed authors, or do not present credible records.
4. Ecological literature. Studies involving individual species or groups of species in surveys of mass bleaching, Acanthaster outbreaks, disease and other species-specific research have been taken into account in the present study where authors are known to have appropriate identification skills.
5. Collections. Veron’s collection of approximately 28,000 specimens originally held at the Australian Institute of Marine Science and subsequently moved in part to the Museum of Tropical Queensland, Australia included voucher specimens of species under taxonomic review collected from ecoregions shown in green in the accompanying map (Figure 2) as well as extensive contributions from other ecoregions from colleagues. However, since the mid-1990s, restrictions due to the Convention on International Trade in Endangered Species (CITES) have made such specimen transfers increasingly problematic and many collections remain in their country of origin even though some have no facilities for their long-term curation.
Coral collections in 48 museums and research institutions were studied for both taxonomic and biogeographic purposes, see Acknowledgements. Collections specific to well-studied regions, especially in the Philippines, Australia and Japan, have proven particularly valuable for such purposes.
6. Photography. In situ photographs of some genera, notably Porites and Montipora, are seldom helpful for species recognition, but many records of other taxa have been suggested or confirmed by photographs. The images of more than 100 photographers and research workers have been sighted for this purpose with the number of identifiable photographs from each varying from one to several hundred.
7. Personal communications. This has been an extensive and much valued source of records and verification of records, see Acknowledgements.
Despite the extent of all these information sources it is stressed that they can never be up-to-date let alone complete, especially for ecoregions that remain poorly known or are currently under study, see Discussion.
Ecoregion-based data
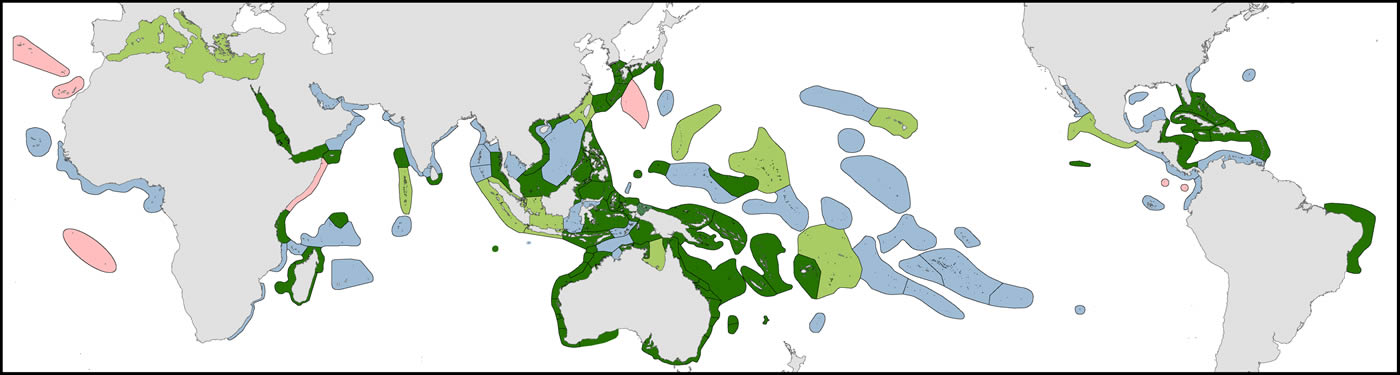
Pre-assessed data from combined sources (above) were collated into ecoregion-specific files that compared the various sources and highlighted potential anomalies for further scrutiny. This process, through many reiterations, progressively narrowed decision-making to the point where additional data searches specifically targeted individual species. Figure 3 is a typical example of a species distribution map, found within the Species Factsheets and accessible throughout this website, based on this process. For the purposes of analyses, strongly predicted and confirmed data points are combined. Any data not meeting at least 'strongly predicted' standards are excluded (see 'Data reliability' below for justification. Strongly predicted records for individual species in individual ecoregions were only added if all the following conditions were met: (a) the species is present in one or more immediately adjacent upstream ecoregions, (b) all known habitat requirements of the species are present and (c) there are no known reasons (such as environment degradation) for the species not to be present. The inclusion of strongly predicted records is thus both highly intuitive and conservative and these have an essential role in the analyses below. They vary greatly among ecoregions so that at one extreme few records are confirmed and 85% or more are strongly predicted (5% of ecoregions) and at the other extreme (60% of ecoregions) <15%, if any have strongly predicted records because they have been well studied and most records have been confirmed. The south-west coast of the Indonesian island arc is poorly known compared with the rest of Indonesia and the use of strongly predicted records for remote reefs of the south Pacific is relatively speculative because pathways of ocean surface currents are both weak and variable. In addition, previously confirmed records were downgraded to strongly predicted where recent taxonomic, identification, or data quality queries had been identified and were not sufficiently significant to exclude the species at this time.
Format of species distribution maps showing confidence level in data records. Off-white: no record; dark green: confirmed record; pale green: strongly predicted record; tan-grey: published record that warrants further investigation. Figure 3.
Species-specific data
Just as ecoregions have far from equal coverage, so have species. Records of all species, irrespective of the ecoregion in which they were recorded, were attributed to one of the following three categories of data robustness. (1) Data robust species have highly indicative distributions where within-ecoregion records are suitable for detailed assessment and where gaps within the overall distribution range are more likely to be due to non-occurrence (in well-studied ecoregions) rather than missing records. (2) Data incomplete species have indicative distributions where gaps within the overall range may have many causes including, for example, missing records and non-occurrence. Quantitative assessments of these two groups of species include both confirmed and strongly predicted occurrences in ecoregions as described above. (3) Data deficient species have poorly known distributions which may be due to taxonomic or identification difficulties, rarity or where the species occurs in seldom visited habitats. Species that have been described or validated after Veron (2000a) may also have poorly known distributions.
Except for our map of global diversity, all analyses below exclude species and within-ecoregion records belonging to the data deficient category.
Data reliability
It is emphasised that this study has had to confront a wide range of data quality issues, both taxonomic and geographic. Coral Geographic gives details on both these subjects yet both constantly change with new information. Table 1 indicates the principal issues and our response to them. This overview should therefore be viewed as a hypothesis, one well-grounded in detail yet containing significant areas of doubt. Some of the following issues are raised elsewhere in this publication.
| Issue | Our response |
|---|---|
| Most species are not units yet we treat them as if they were (Veron, 1995, 2000a). | There is none: taxonomic and geographic boundaries are both fuzzy, see Discussion. |
| Many species are as yet undiscovered or undescribed. | Cryptic species notwithstanding, we believe we have most mainstream species. Future additions are thus unlikely to change the fundamental template. |
| More experienced fieldworkers find more species. | Our data contain this bias: strongly predicted records help to overcome it. |
| Better known species have more records. | Our data contain this bias: strongly predicted records help to overcome it. |
| Taxonomic error and disagreement including differences in synonymy affect diversity (Sheppard, 1998). | The effect is likely to be small as the taxonomic framework we have is uniform across all ecoregions. For synonymies used in this website see Taxon Finder. |
| Sampling effort varies among ecoregions. | This is reality: strongly predicted records (see below) help overcome it. |
| Ecoregion boundaries affect results. | This is unavoidable. Boundaries are based on the best information available, both published and unpublished, but have different levels of support. |
| Records from mesophotic zones are few (Kϋhlmann, 1983; Lesser et al., 2009; Bridge et al., 2012; Harris et al., 2013; and others). | This is a significant issue. We include all data available, but these are limited. |
| Ecoregion scales do not recognise small-scale ecological issues. | This level of detail is addressed in species-specific data, not geographic data. |
| Why not use only confirmed records? | This would enormously increase the biases noted above. |
Table 1. Core data issues and how they are managed in this publication.
Analyses
This study differentiates between patterns of species diversity (meaning species richness) where the identity of species is not necessary (Figures 4 and 17), and patterns of species affinity where it is (all other Figures).
Figure 4, global diversity, was calculated by adding all records of occurrence (the addition of all species maps) using ArcMap 10.2.1 (ESRI 2013).
Dendrograms of affinity (Figures 5-14) were carried out in XLSTAT using the Dice coefficient (which ignores negative co-occurrence) and unweighted pair group averages. Additional explanation of analytical protocols where relevant are given in the Figure captions. In order to reduce information noise, all analyses of affinity exclude four outlying ecoregions: the Mediterranean (4 species), Christmas Island (which is isolated and where there is little original data), the Madeira Islands (4 species, also isolated) and North Florida to Carolina (6 species).
Figure 15, showing geographic ranges and Figure 16, showing numbers of confirmed and strongly predicted Indo-Pacific species richness, were both generated by Excel directly from the Coral Geographic database.
Figure 17, centroid positions (meaning the centre of gravity of each ecoregion polygon) were calculated (in two dimensions, longitude and latitude) by averaging the coordinates of all of vertices along the perimeter of each polygon. Centroid calculations were performed in ArcMap 10.2.1 (ESRI 2013) on spatial layers displayed using a WGS84 / PDC Mercator projection.
Figure 18, levels of endemism in the central Indo-Pacific, were calculated by the endemism richness index (Kier and Barthlott, 2001 and Crisp et al., 2001) (see Casagranda et al. 2012 for comparison with other methods of describing endemicity). For each ecoregion in which a species occurs, the ecoregion x species cell value is calculated from the proportion of the species’ total number of occurrences. For example, if a species is endemic to an ecoregion (does not occur elsewhere) it has a value of 1 for that ecoregion. If a species also occurs in 99 other ecoregions, the value becomes 1/100 or 0.01 for that ecoregion. Values for all species in each ecoregion are then summed. Since endemism is correlated with the absolute number of species in an ecoregion, the endemism richness index is then corrected by the ecoregion species richness to give the corrected endemism richness index shown in the Figure.
Results
To examine the data in more detail see Coral Geographic.
The global pattern
The pattern of global diversity is similar to that of Veron (2000a) with the epicentre of diversity in the Coral Triangle but secondary centres in the Red Sea and in the region of northern Madagascar are now identified.
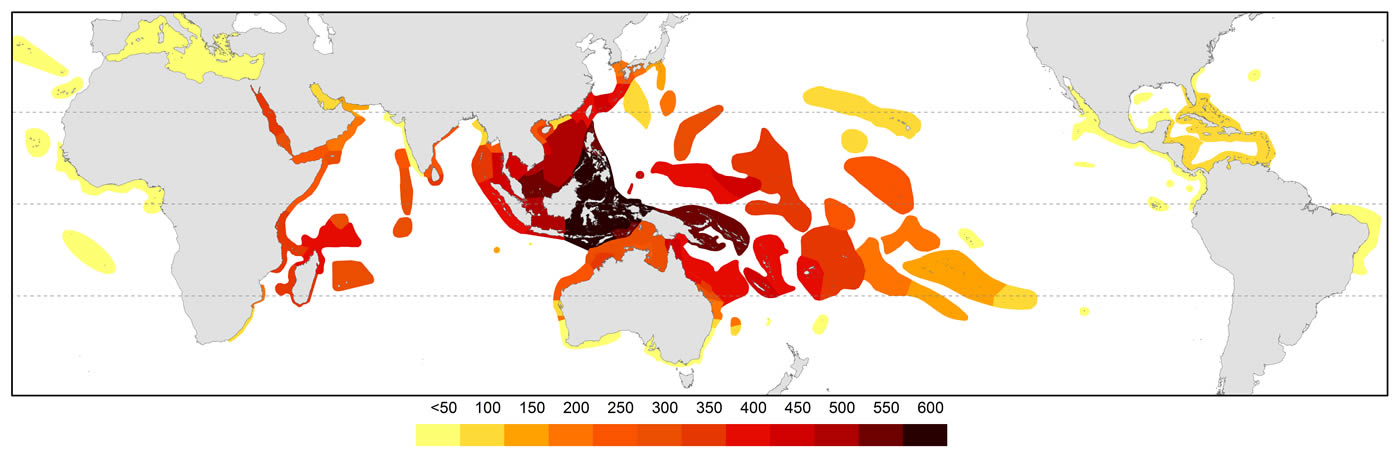
Global diversity indicated by all records of occurrences. Diversity values were derived from GIS layering of all species maps. Figure 4.
Global affinities of ecoregions show three well-defined provinces within the Atlantic. However, delineation of provinces within the Indo-Pacific is somewhat arbitrary. Further details are given below.
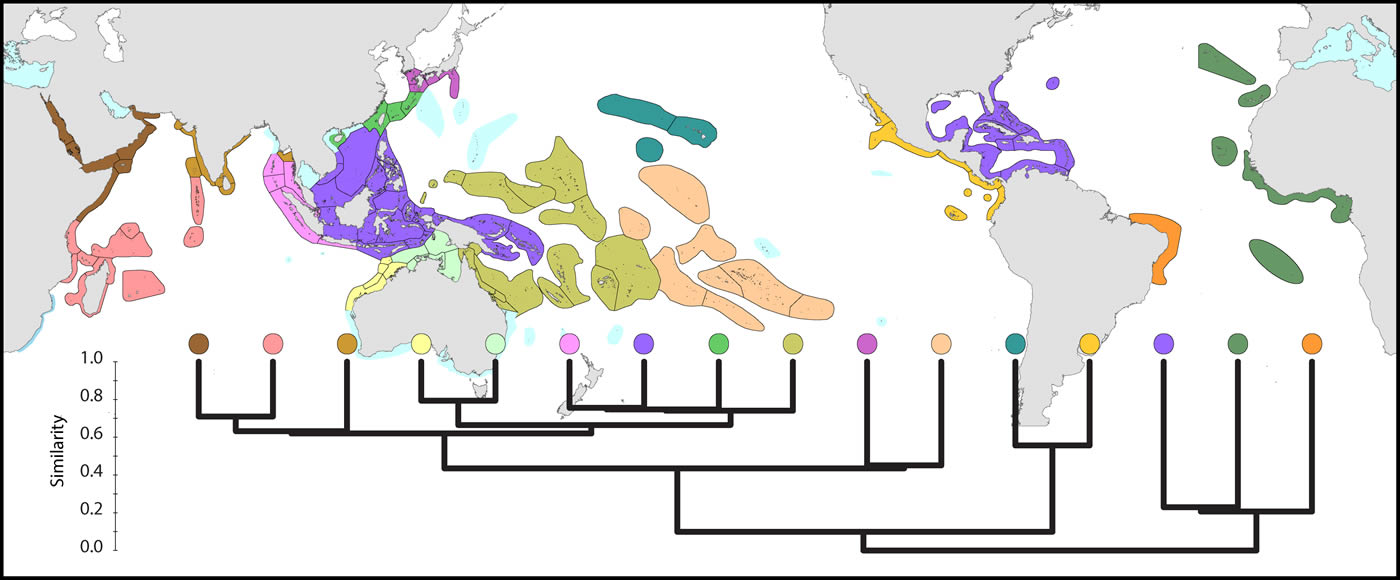
Global pattern of affinity truncated at the highest 22 divisions in order to provide clarity. Note (a) that excluded ecoregions (coloured pale blue) are included in relevant regional diagrams below and (b) that the similarity scale indicates the position of nodes only. Each tine above these nodes represents ecoregions of matching colour. Figure 5.
Regional patterns
In addition to this general template, there are three regions characterised by latitudinal attenuation (or ‘species drop-out’) along the path of major continental boundary currents: the Kuroshio from the Philippines to mainland Japan, the Leeuwin Current of west Australia, and the East Australian Current.
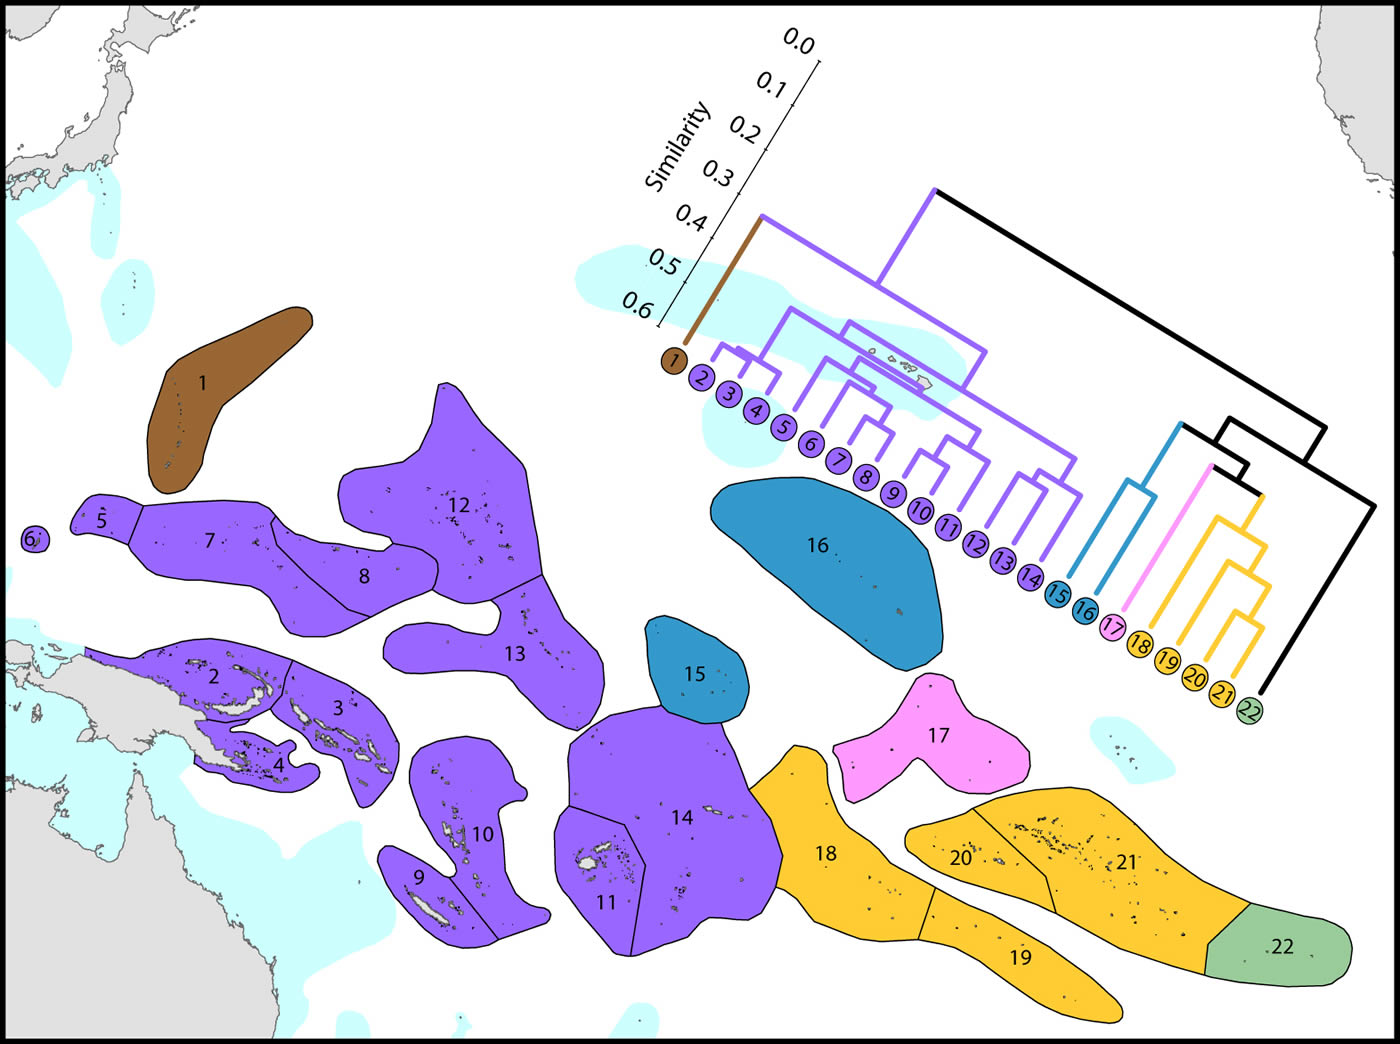
The Central Indo-Pacific
The Coral Triangle is at the heart of global coral distributions with a band from the Sulu Sea to the ‘Bird’s Head’ at the western-most point of New Guinea being the global centre of diversity of corals as well as many other marine taxa. This region, delineated by Veron et al. (2009), is divided into two groups of ecoregions, the main group in the west and three ecoregions to the east. The level of similarity of ecoregions within the main group is so high that the whole region almost qualifies as being one large ecoregion, similar in this respect to the Caribbean.
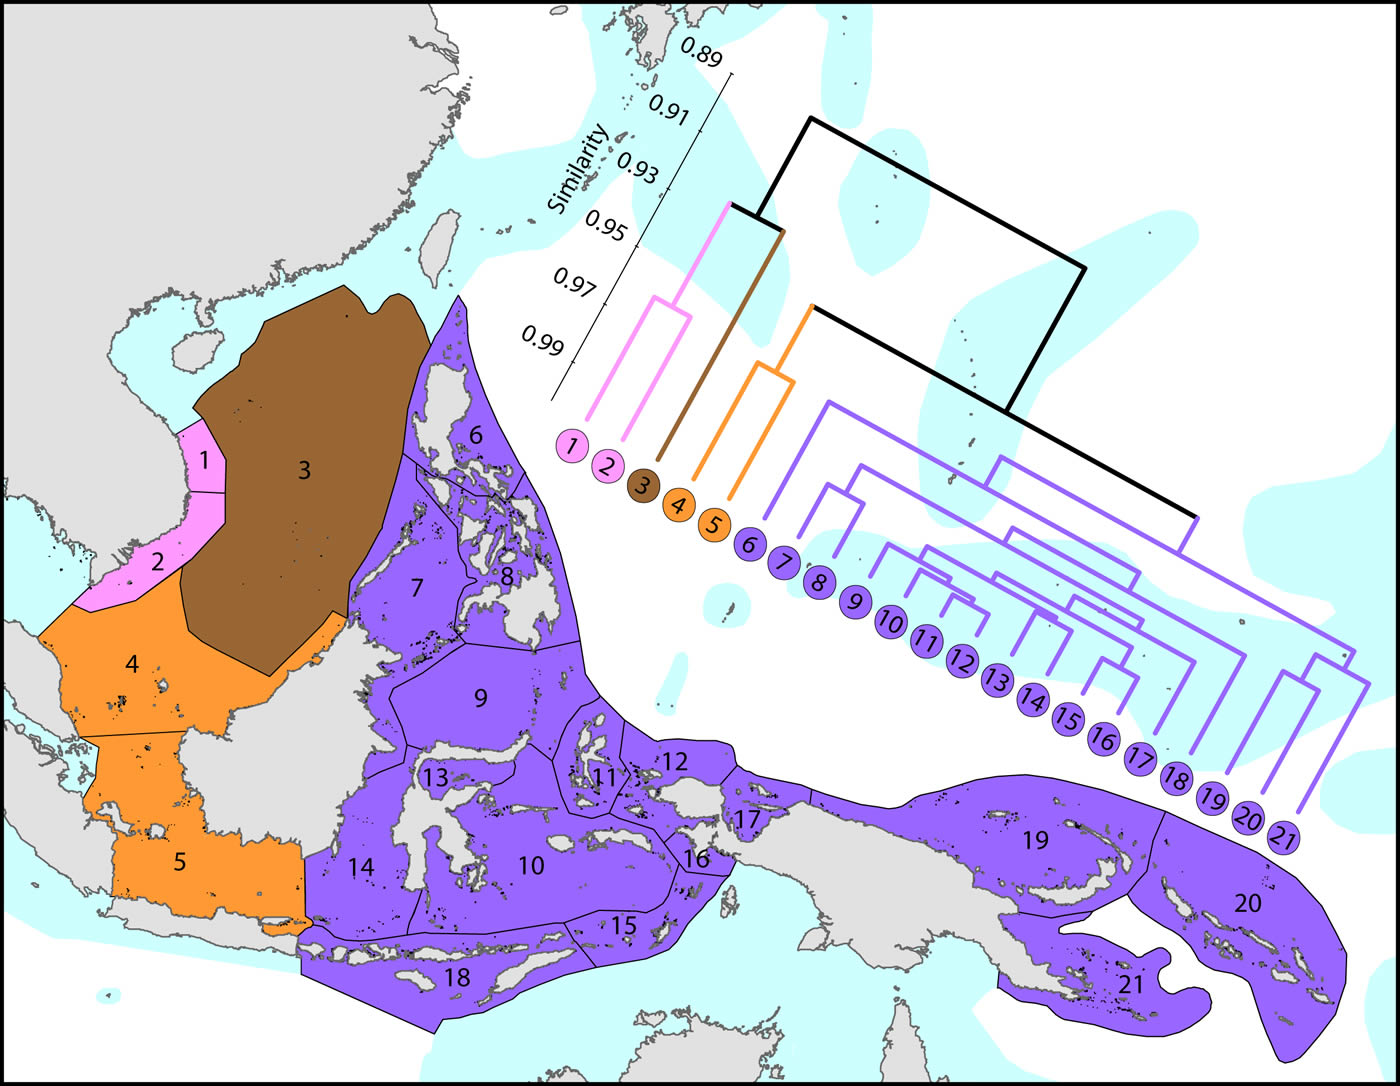
Affinities of ecoregions in and adjacent to the Coral Triangle. This dendrogram was produced by the progressive exclusion of outlying ecoregions; there were no internal exclusions. See below for number of species within ecoregions. Figure 6.
On a broader scale, the Coral Triangle, with 627 species in total, is only weakly delineated from surrounding ecoregions as Veron et al. (2009) noted. Of the latter, the coral fauna of the Java Sea (numbered 5) and the Sunda Shelf (numbered 4) is very similar to those of the Coral Triangle. The ecoregions from South China Sea and Vietnam also have a close affinity with the Coral Triangle but the diversity is lower. Of conservation importance, these mega-diverse ecoregions to the west of the Coral Triangle have 7 species not found in the Coral Triangle.
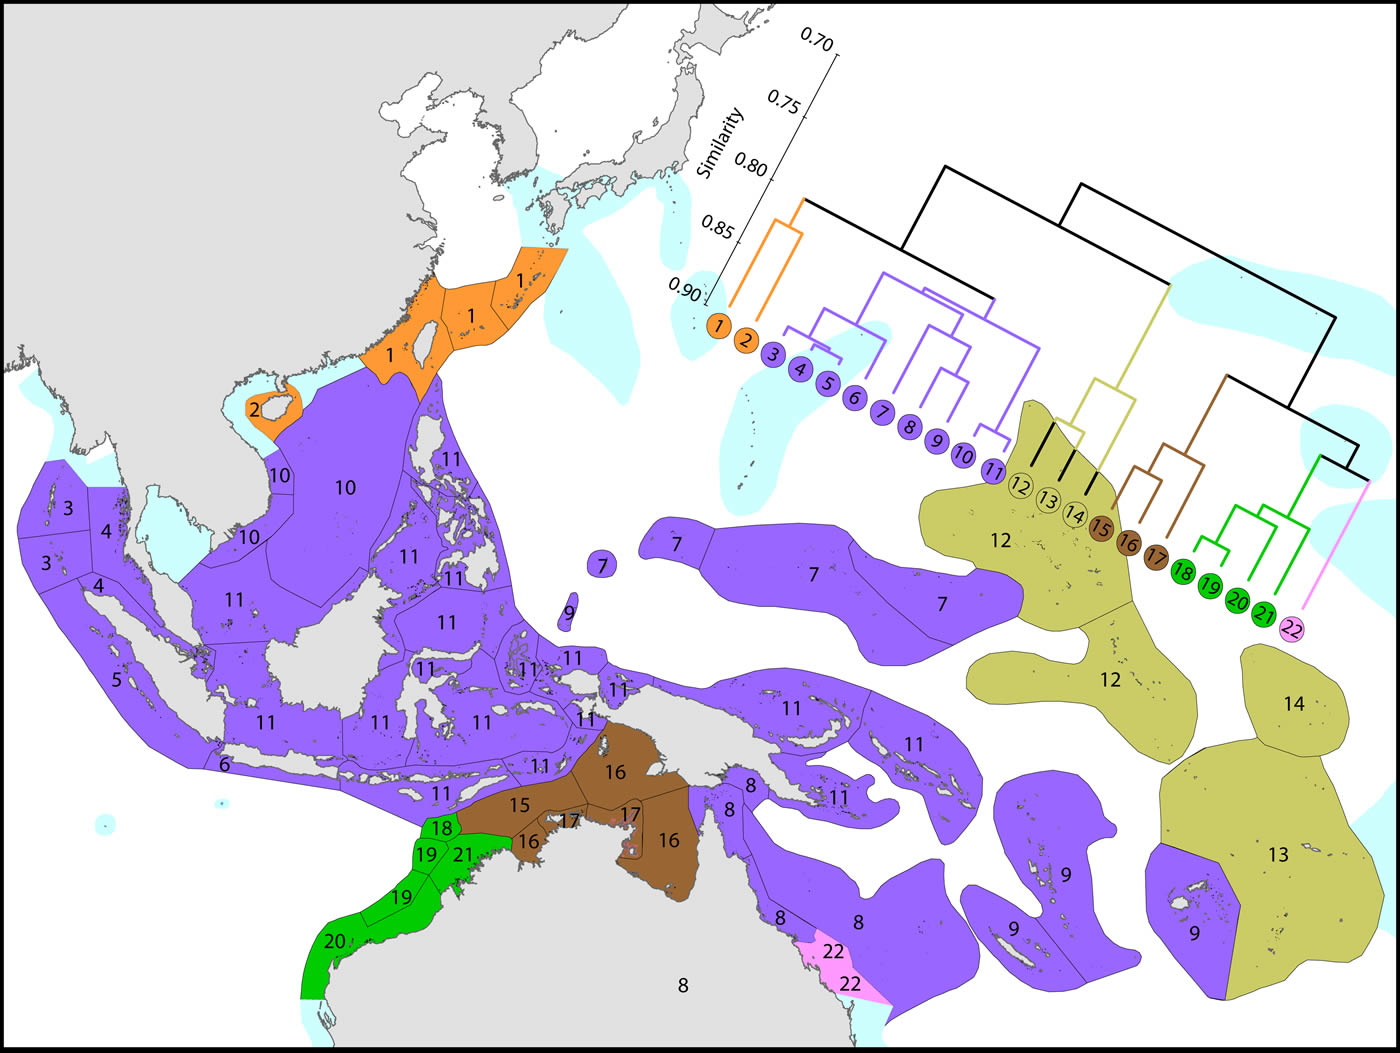
Affinities of ecoregions in and around the Central Indo-Pacific. This dendrogram was produced by the progressive exclusion of outlying ecoregions; there were no internal exclusions. See below for number of species within ecoregions. Figure 7.
Diversity and affinity both decrease with distance in all directions from the Coral Triangle, but do so at unequal rates. To the west the ecoregions from Sumatra to the Andaman Sea retain substantial affinity with the central Indo-Pacific. These have been the subject of several recent reports although our data do not support claims of very high diversity in the Andaman and Nicobar islands. There is no evidence of the existence of the formation of separate provinces in the Indian and Pacific Oceans. The fauna of NW Australia (numbered 18-21) is clearly delineated from that of the Coral Triangle.
Attenuation to the north and south
To the north, the Kuroshio, one of the world’s strongest boundary currents, clearly creates the pattern of diversity illustrated.
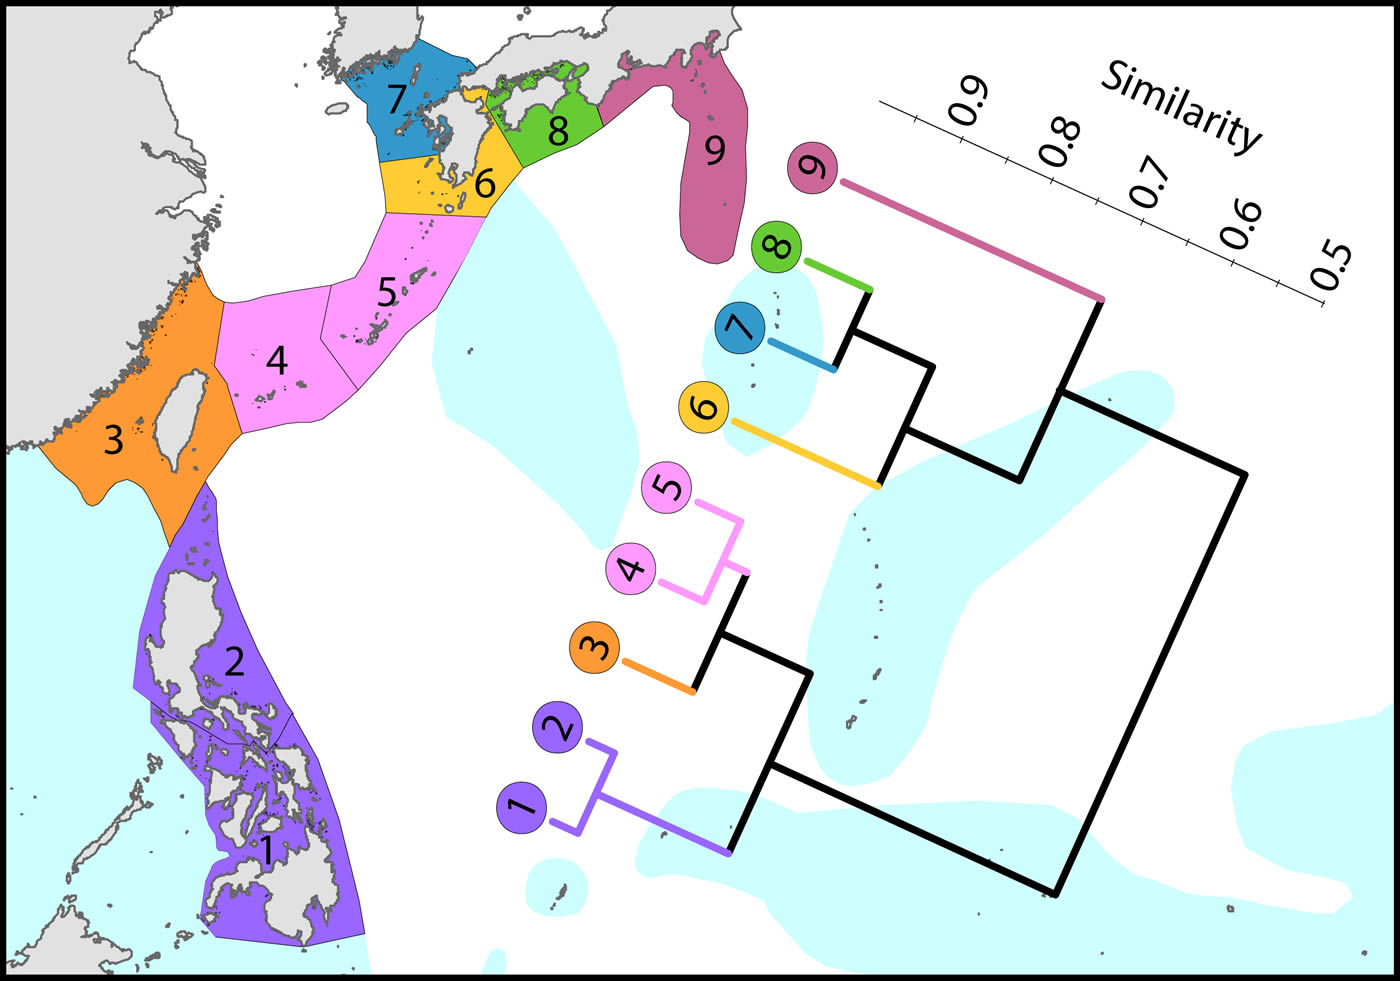
Latitudinal attenuation of affinity and diversity of ecoregions along the path of the Kuroshio. Ecoregions in the Coral Triangle (numbered 1 and 2) are strongly delineated from other ecoregions and ecoregions to the north with coral reefs (numbered 3 to 5) are strongly delineated from those without reefs (numbered 6 to 9). Ecoregions excluded (Hong Kong, Ogasawara and Okinotorishima) are outliers in this classification. Hong Kong is very depauperate and the Japanese locations are peripheral to the core of the Kuroshio. See Ecoregion Factsheets/Species for number of species within ecoregions. Figure 8.
Coral affinities of all tropical Australian reefs are sharply differentiated from the Coral Triangle, the separation being due to the shallow turbid water as well as the strong tidal regimes of the Timor Sea. The corals of the west Australian coast have a marginally lesser affinity with the Coral Triangle than those of the northern Great Barrier.
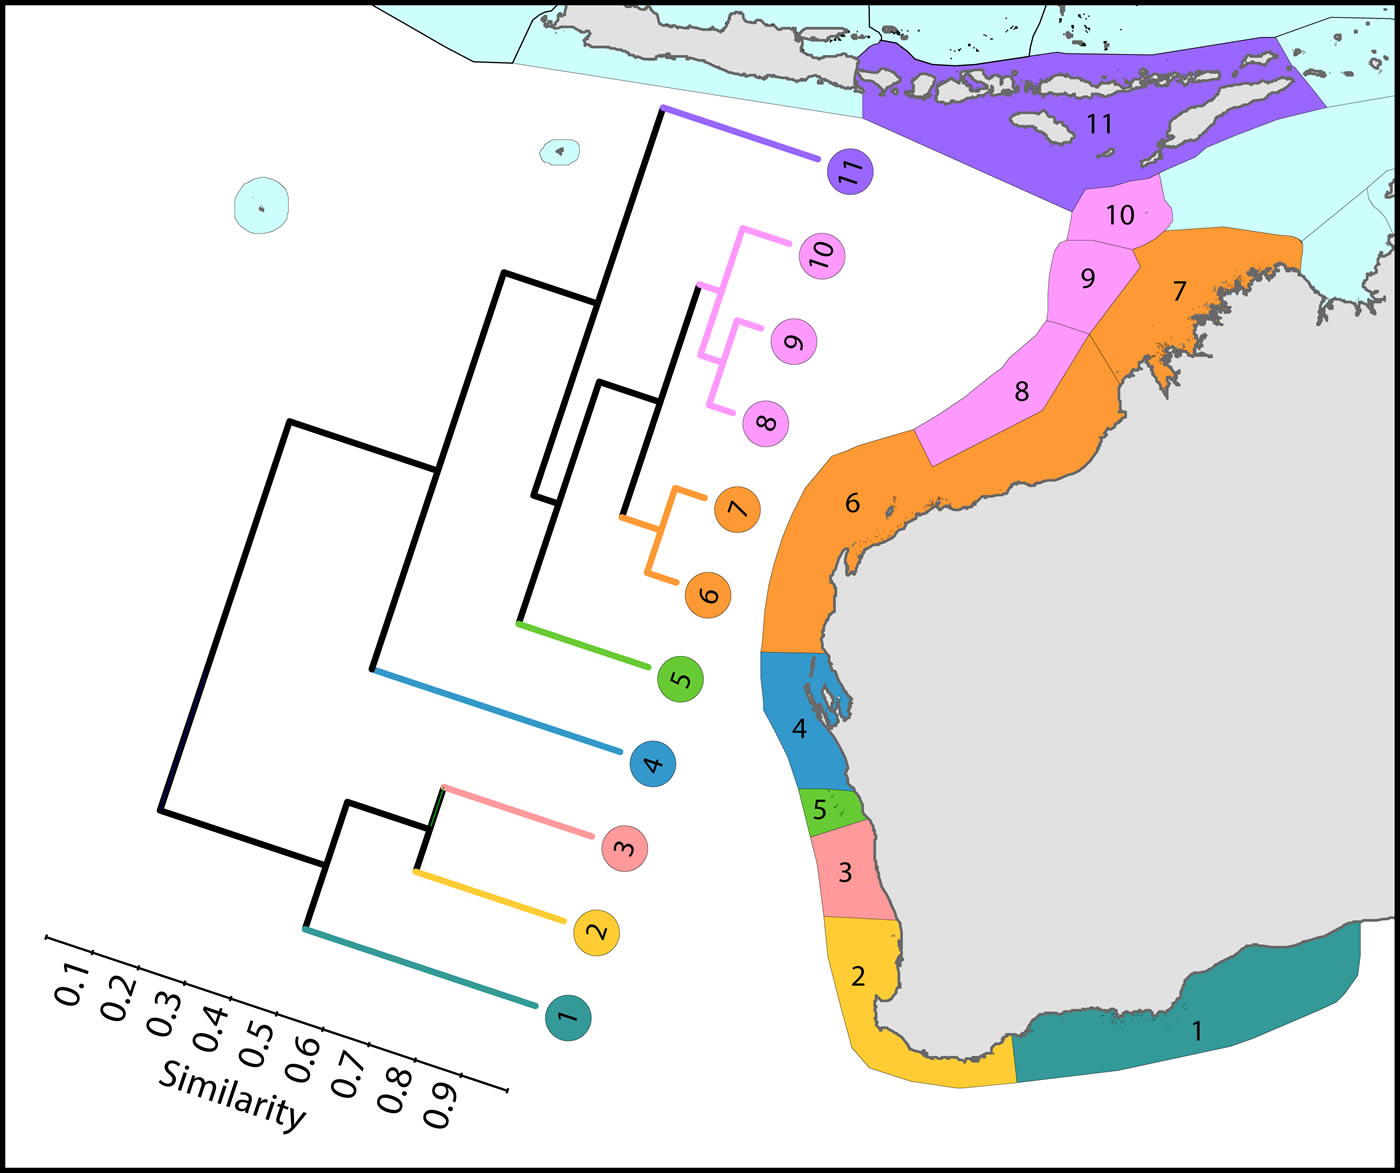
Latitudinal attenuation of affinity and diversity of ecoregions along the path of the Leeuwin Current. The primary divisions in the dendrogram are between the Lesser Sunda Islands of the Coral Triangle (numbered 11), the offshore reefs of NW Australia (numbered 8-10), the coastal reefs of NW Australia (numbered 6 and 7), subtropical reefs (numbered 4 and 5) and temperate non-reef ecoregions (numbered 1-3). Figure 9.
Harriott and Banks (2002) give a useful analysis of latitudinal variation of eastern Australian corals, which remains relevant with updated records from this study.
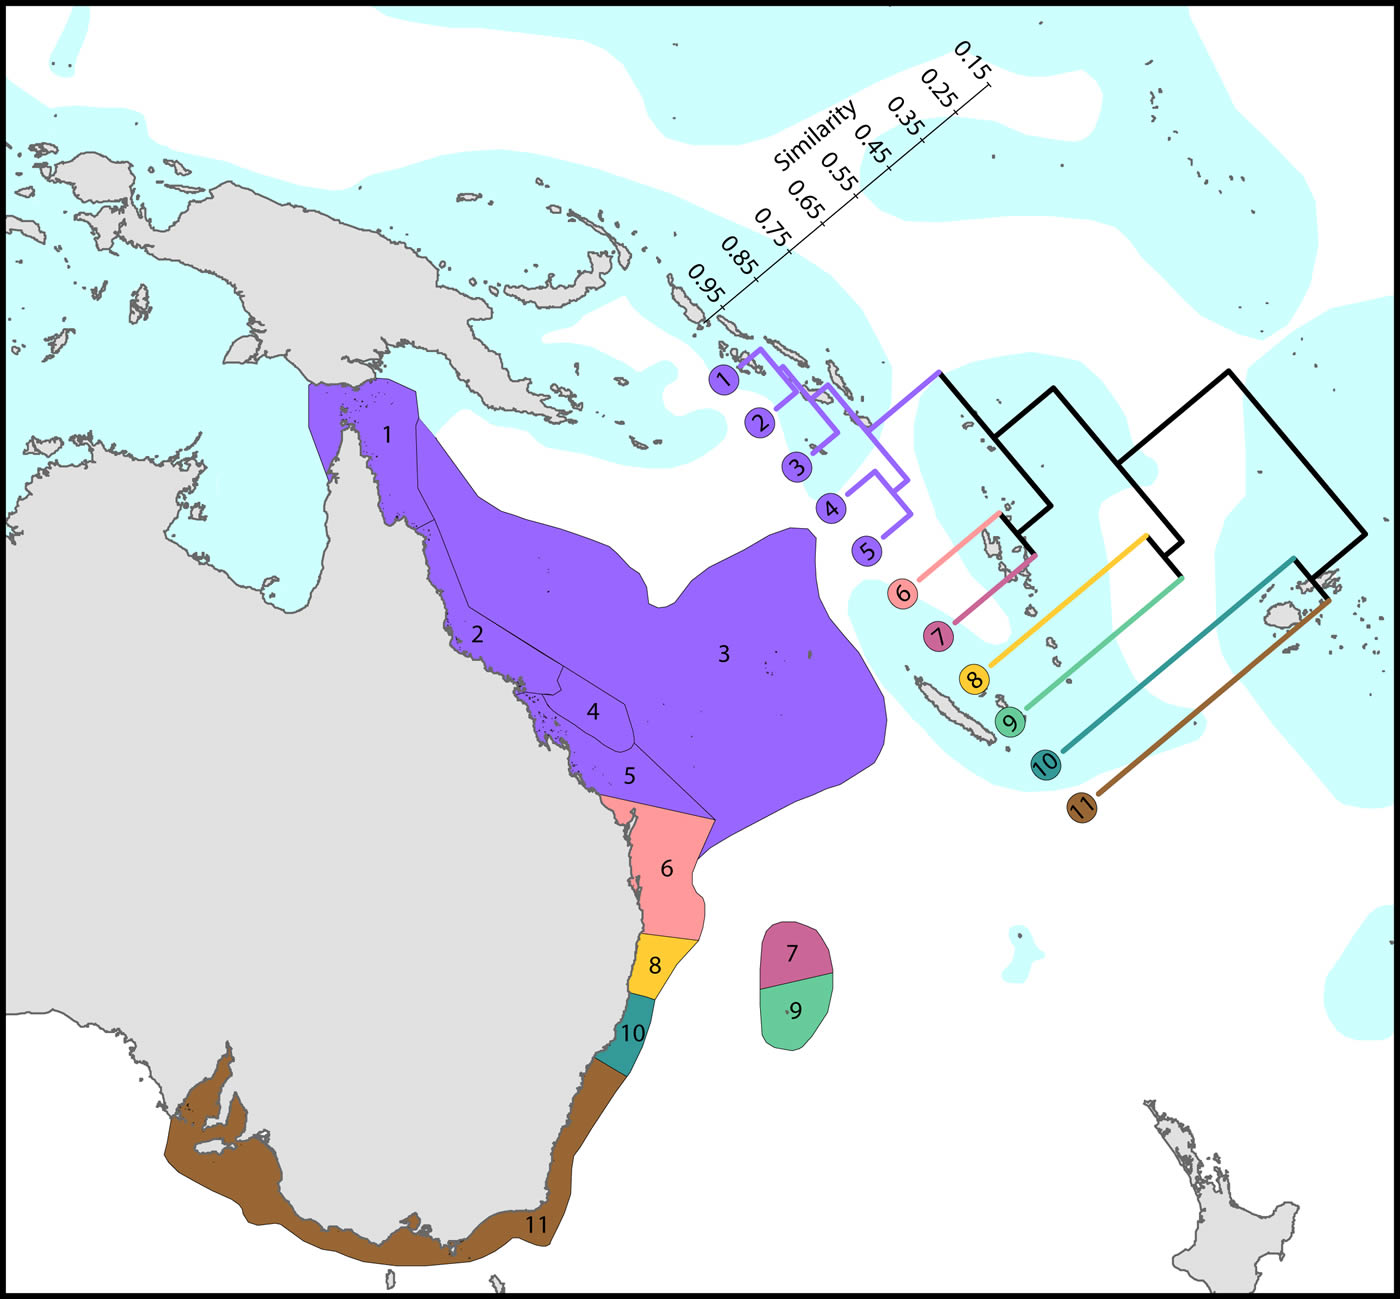
Latitudinal attenuation of affinity and diversity of ecoregions along the path of, or under the influence of, the East Australian Current. The two southern coastal ecoregions (numbered 10 and 11) are depauperate outliers whilst the Solitary Islands (numbered 8) groups with ecoregions which have reefs, reflecting their nearshore location. The ecoregions of the Great Barrier Reef (numbered 1, 2, 4 and 5) show a weak latitudinal attenuation. This dendrogram was produced from selection of relevant ecoregions. Figure 10.
The central and western Indian Ocean and Red Sea
Ecoregions of this region are divisible into four groups:
(1) The Red Sea and nearby ecoregions, numbered 13 to 17. The northern Red Sea has the northernmost consolidated coral reefs in the world, reef development being limited by the geographic extent of the Red Sea, not by temperature as are the northernmost reefs of Japan. The Red Sea has a similar diversity to ecoregions to the south and has the highest level of endemism in the Indian Ocean region. The number of species in the northern and southern Red Sea is similar (305 and 302 respectively) although compositions are marginally different probably due to differences in the ranges of habitats. Thus, of the 340 species found in the Red Sea, 333 occur elsewhere; the remainder are endemics. Species attenuate abruptly from this peak to ecoregions in and around the Gulf of Aden. The Gulf of Aden, especially the north coast, has few reefs due to the influence of cold upwelling, a major barrier to distribution as is the shallow water of the entrance to the Red Sea which forms a complete barrier during intervals of low sea levels during deep glacial cycles, as noted by Sheppard, Price and Roberts (1992) and many geological publications. The east Somali coast, the Socotra islands and Yemen (numbered 13-15) are also affected by monsoonal upwelling although the north coast of Socotra has a relatively high diversity.
(2) Southern hemisphere ecoregions of high diversity, numbered 3 to 10. This is the Indian Ocean centre of diversity which most of the historic contour maps mentioned above vaguely indicated. The northern and southern Seychelles have substantially different faunas to each-other as they are dominated by fringing reefs of continental islands and atolls, respectively. The Mascarene Islands (numbered 10) have near-shore fringing reefs but a lesser habitat diversity than other ecoregions of this group.
(3) Chagos and the Maldives. Chagos archipelago (numbered 12) acts as a crossroad, called the ‘Chagos Stricture’ by Veron (1995), between the east and west Indian Ocean with no known endemics, Ctenella chagius having been found in the Mascarene Islands. The Maldives and Chagos Islands (numbered 11 and 12 respectively) have closer affinities with the high diversity ecoregions to the west than those to the east, which come into the range of influence of the Coral Triangle.
(4) High latitude ecoregions of low diversity. Two ecoregions on the south-east African coast (numbered 1 and 2), two in the northern gulfs (numbered 21 and 24) and those on or near the coast of India (numbered 19, 20, 24 and 25) have relatively low diversities. The Agulhas Current controls latitudinal attenuation along the south-east African coast but not within the Mozambique Channel where it forms gyres rather than a unidirectional flow. The Arabian Sea monsoonal upwelling contributes to isolating the northern gulfs in addition to impacts of harsh continental climates.
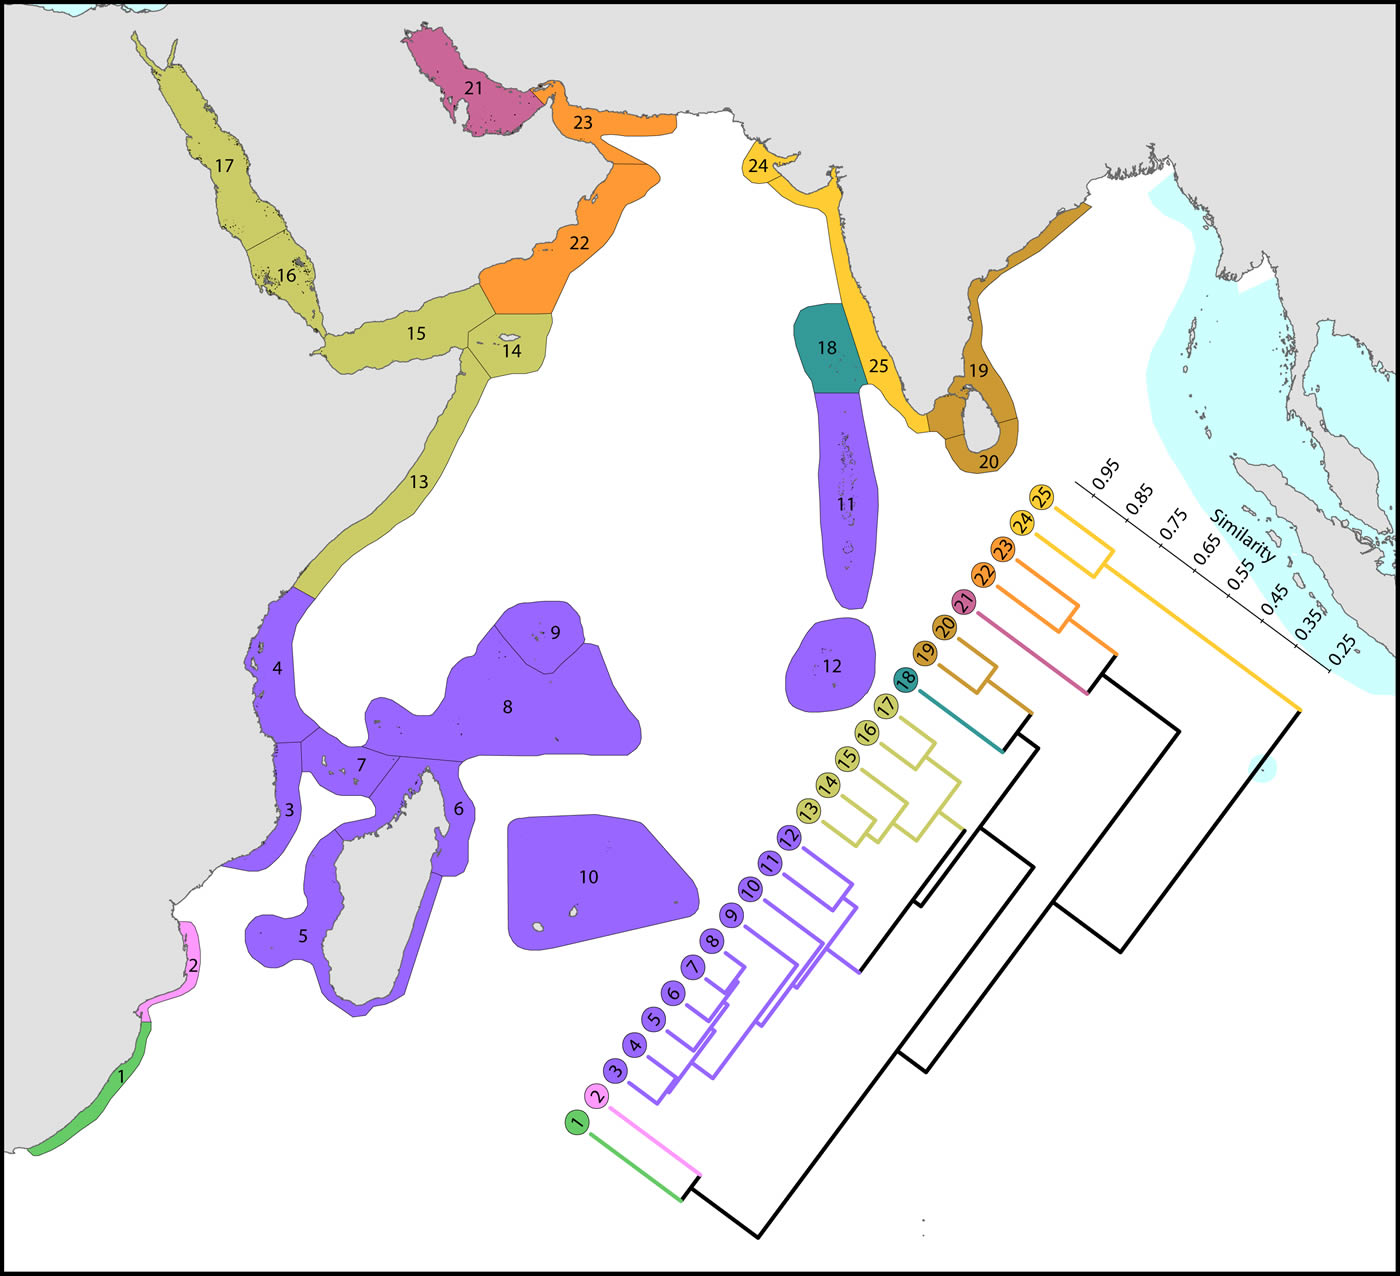
Affinity and of ecoregions of the western Indian Ocean and Red Sea. This dendrogram was produced by the progressive exclusion of outlying ecoregions; there were no internal exclusions. See below for number of species within ecoregions. Figure 11.
Oceanic central and western tropical Pacific
This province is divisible into two main sub-provinces, each with outlying ecoregions, and the Pitcairn Island group:
(1) Western Pacific. The westernmost ecoregions (numbered 1-14) have affinities with the Coral Triangle of which ecoregions numbered 2-4 are a part. Revisions of the corals of Marianas Islands (numbered 1) currently being undertaken may indicate closer affinities with neighbouring ecoregions to the south than indicated here.
(2) Central Pacific. Ecoregions of the central Pacific (numbered 15-21) are distinct from all others but have distant affinities with each-other. Some of these are among the least well studied ecoregions in the world with affinities and diversities known so far being only tentative.
(3) Pitcairn Island group. These islands have no close affinity to any others in the region.
It should be noted that surface currents throughout this region are weak and non-directional compared with most other parts of the Indo-Pacific so that genetic connectivity is also likely to be weak and to have been so throughout the geological history of most of the corals.
Affinity and diversity of ecoregions of the central and western tropical Pacific. Ecoregions in the Coral Triangle (numbered 2-4) are strongly differentiated from other ecoregions. This dendrogram was produced by the progressive exclusion of outlying ecoregions; there were no internal exclusions. See below for number of species within ecoregions. Figure 12.
Central and far eastern Pacific
Ecoregions of this region are divisible into three main groups and three outlying ecoregions:
(1) Central Pacific. The core group (numbered 4-10) are included in this Figure in order to provide context for other ecoregions.
(2) Far eastern Pacific. These (numbered 14-21) ecoregions have been well studied and form a highly distinctive group.
(3) Hawaii and Johnston Atoll. These ecoregions have been well studied and form a depauperate highly isolated group totalling 72 species and hosting regional endemics, see below. Outlying ecoregions. The Marquesas Islands (numbered 11) are poorly known. Clipperton Atoll (numbered 12) has been well studied and is an outlier because of isolation and very low diversity. Easter Island (numbered 13) is also very isolated and depauperate, with no true reef development.
All but five species of the far eastern Pacific occur in the central Pacific suggesting that a wide variety of taxa are capable of very long distance dispersal. The five that do not occur in the central Pacific have most likely gone extinct or have yet to be found there as they are unlikely to have survived glacial conditions in the east.
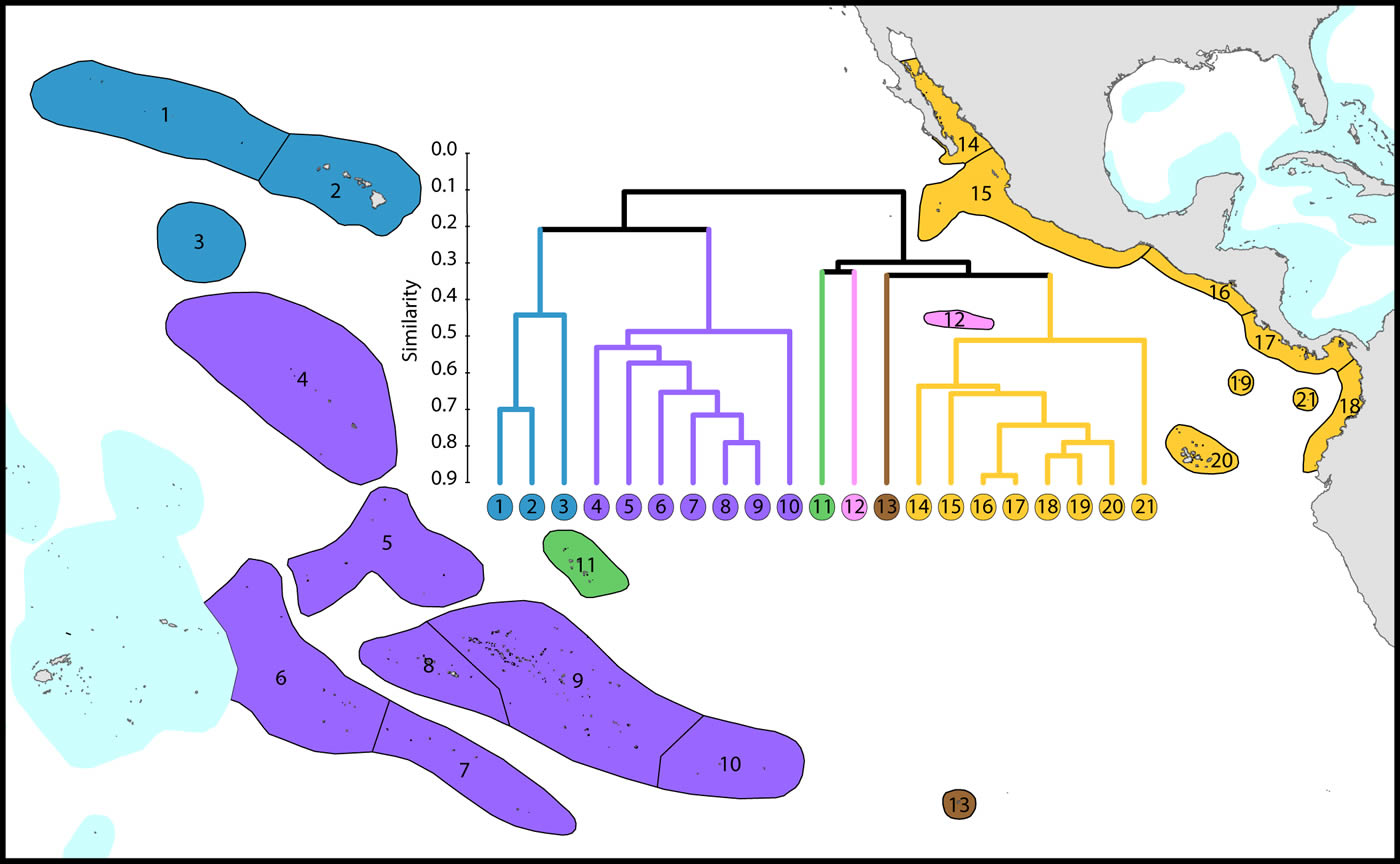
Affinity and diversity of ecoregions of the central and far eastern Pacific. This dendrogram was produced by the progressive exclusion of outlying ecoregions; there were no internal exclusions. See below for number of species within ecoregions. Figure 13.
The Atlantic Ocean
This study re-affirms that there are no species in common between the Atlantic and Indo-Pacific. The level of similarity of ecoregions within the Caribbean (numbered 2-7) is so high that the whole region arguably qualifies as being one large ecoregion and what differences there are may well be due to incomplete records or recent local declines or extinctions (Gardner et al. 2003 and others). Except for the south-west Gulf of Mexico (which has similar fauna to the Caribbean), northern Florida and the Flower Gardens in the northern Gulf of Mexico (which have no shallow reef habitat), the affinities and diversities of ecoregions at increasing distance from the Caribbean are attributable to isolation. Exceptions are the two species of Schizoculina which are endemic to the west African coast and the corals of Brazil which include the three species of Mussismilia and Favia leptophylla, arguably the only genuine Favia of the Atlantic (Veron, 2013). All ecoregions outside the immediate vicinity of the Caribbean have relatively low affinities with each-other.
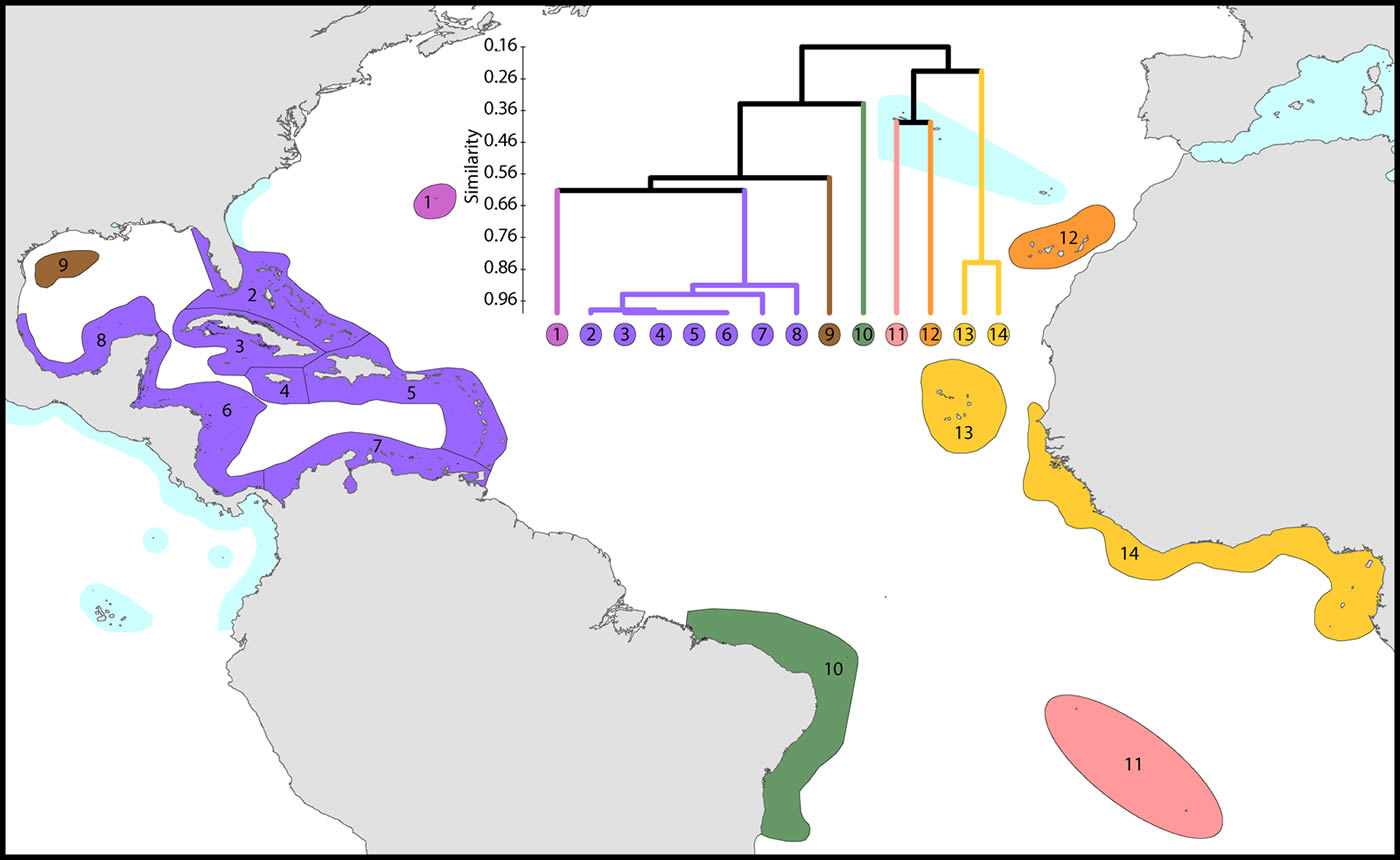
Affinity and diversity of ecoregions of the Atlantic Ocean. This dendrogram was produced by the progressive exclusion of outlying ecoregions; there were no internal exclusions. See below for number of species within ecoregions. Figure 14.
Distribution characteristics of species
When detailed maps of species are combined they show the following general characteristics.
Geographic ranges
Because of their capacity for long distance dispersal as well as their geological longevity, a high proportion of species have very extensive geographic ranges. In the diagram below, the two tallest (red) columns show that about half of all species occur in temperate latitudes of both hemispheres. Longitudinal ranges are very variable, but nearly half of all species have ranges at least as wide as the Indian Ocean.
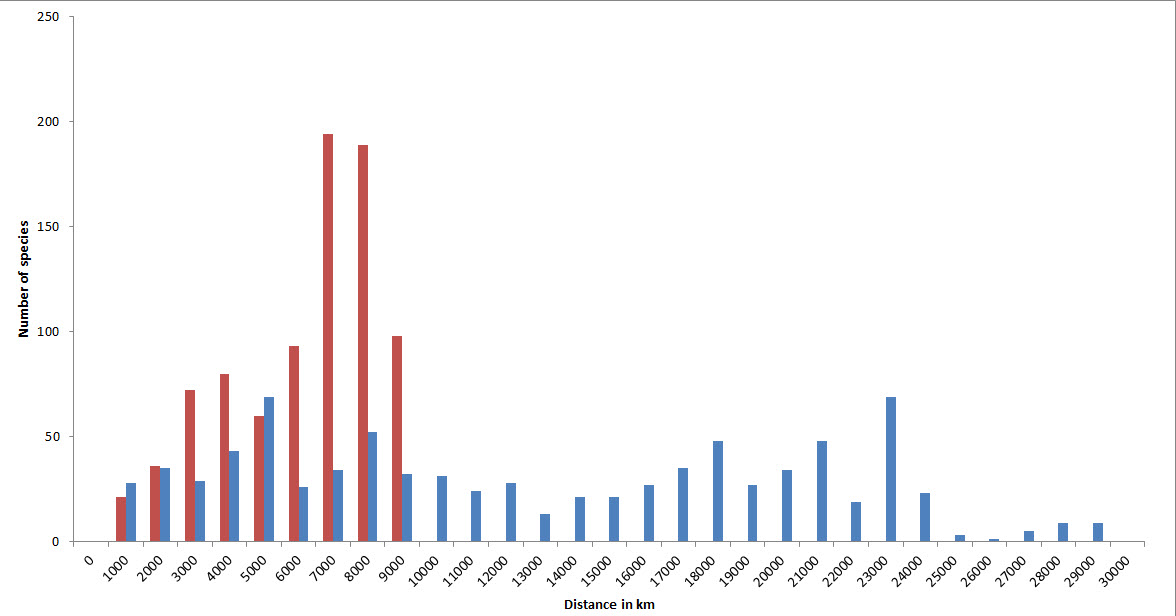
Geographic ranges of confirmed and strongly predicted Indo-Pacific species. Red = latitudinal ranges, blue = longitudinal ranges. Figure 15.
A high proportion of species also occupy a large number of ecoregions, with 270 occupying over 50% of all Indo-Pacific ecoregions.
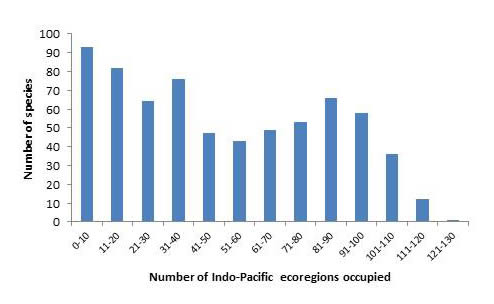
Number of confirmed and strongly predicted Indo-Pacific species in ecoregions. Figure 16.
Latitudinal attenuation
Latitudinal attenuations along three of the Indo-Pacific’s continental boundary currents create a biogeographic template second in importance only to the existence of the Coral Triangle. These patterns are influenced by high-latitude endemics, but unlike most other major taxa they are primarily due to latitudinal extension of tropical species rather than replacement of tropical by temperate species.
Amphitropical distrubutions
These are disjunct distributions where species occur sub-tropically both sides of the tropics. They have most commonly been recorded in fish and have attracted many evolutionary explanations. This study reinforces conclusion that coral species do not show amphitropical patterns (Veron 1995), but if Australian endemic species are discounted (not illustrated), high latitude Japanese and Australian ecoregions form a cluster within global patterns of affinity which overrides geographic positions. This shows that that species found in high latitudes are relatively environmentally tolerant (an implication of ‘Rapoport’s Rule’, Stevens, 1989) although, in contrast to fish, most also occur equatorially.
Centroid positions
Indo-Pacific coral genera have centroid positions (the geographic centre of all species within all ecoregion records) near the equator and, except for two genera, have similar longitudinal centroid positions near the centre of the Coral Triangle. The two exceptions are Stylophora and Pocillopora. All Stylophora species have ranges extending to the Red Sea whereas Pocillopora has highest diversity in the Pacific.
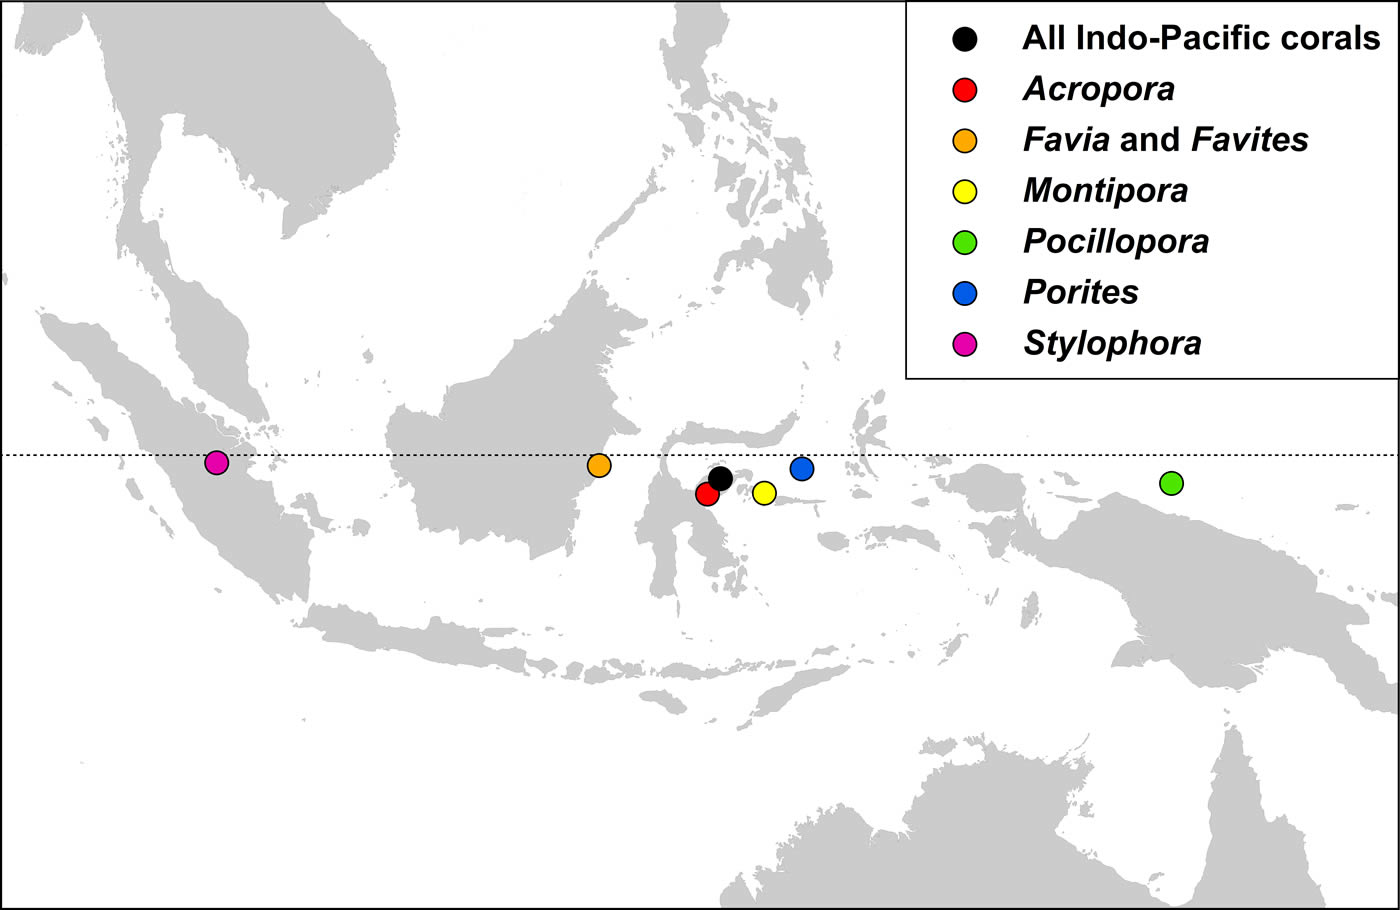
The centroid position of all Indo-Pacific corals records combined and those of some major generic groups, see text. Figure 17.
Endemicity
Calculations of endemicity are always dominated by relative area (reviewed by Casagranda, Taher and Szumik 2012) and thus change if the area under consideration is changed. At overview level, the Red Sea (with 7 endemics, or 2.1% of the total) has the highest endemism in the Indian Ocean. The Coral Triangle as a whole,(with 21 endemics, or 3.35% of the total, has the highest level of endemism of all diverse ecoregions in the world although (as Veron, 1995 noted), the diversity of the region is primarily due to the overlapping of large species ranges as opposed to the presence of large number of endemics. The low levels of endemism in the south Pacific are due to the prevalence of highly dispersed species reaching these isolated locations and thus all ecoregions have low endemicity at species level but probably high endemicity at sub-species levels. These interpretations may change when undescribed species known by the authors to exist in the Coral Triangle and some other ecoregions are factored in. They may also reflect sampling effort within the Coral Triangle.
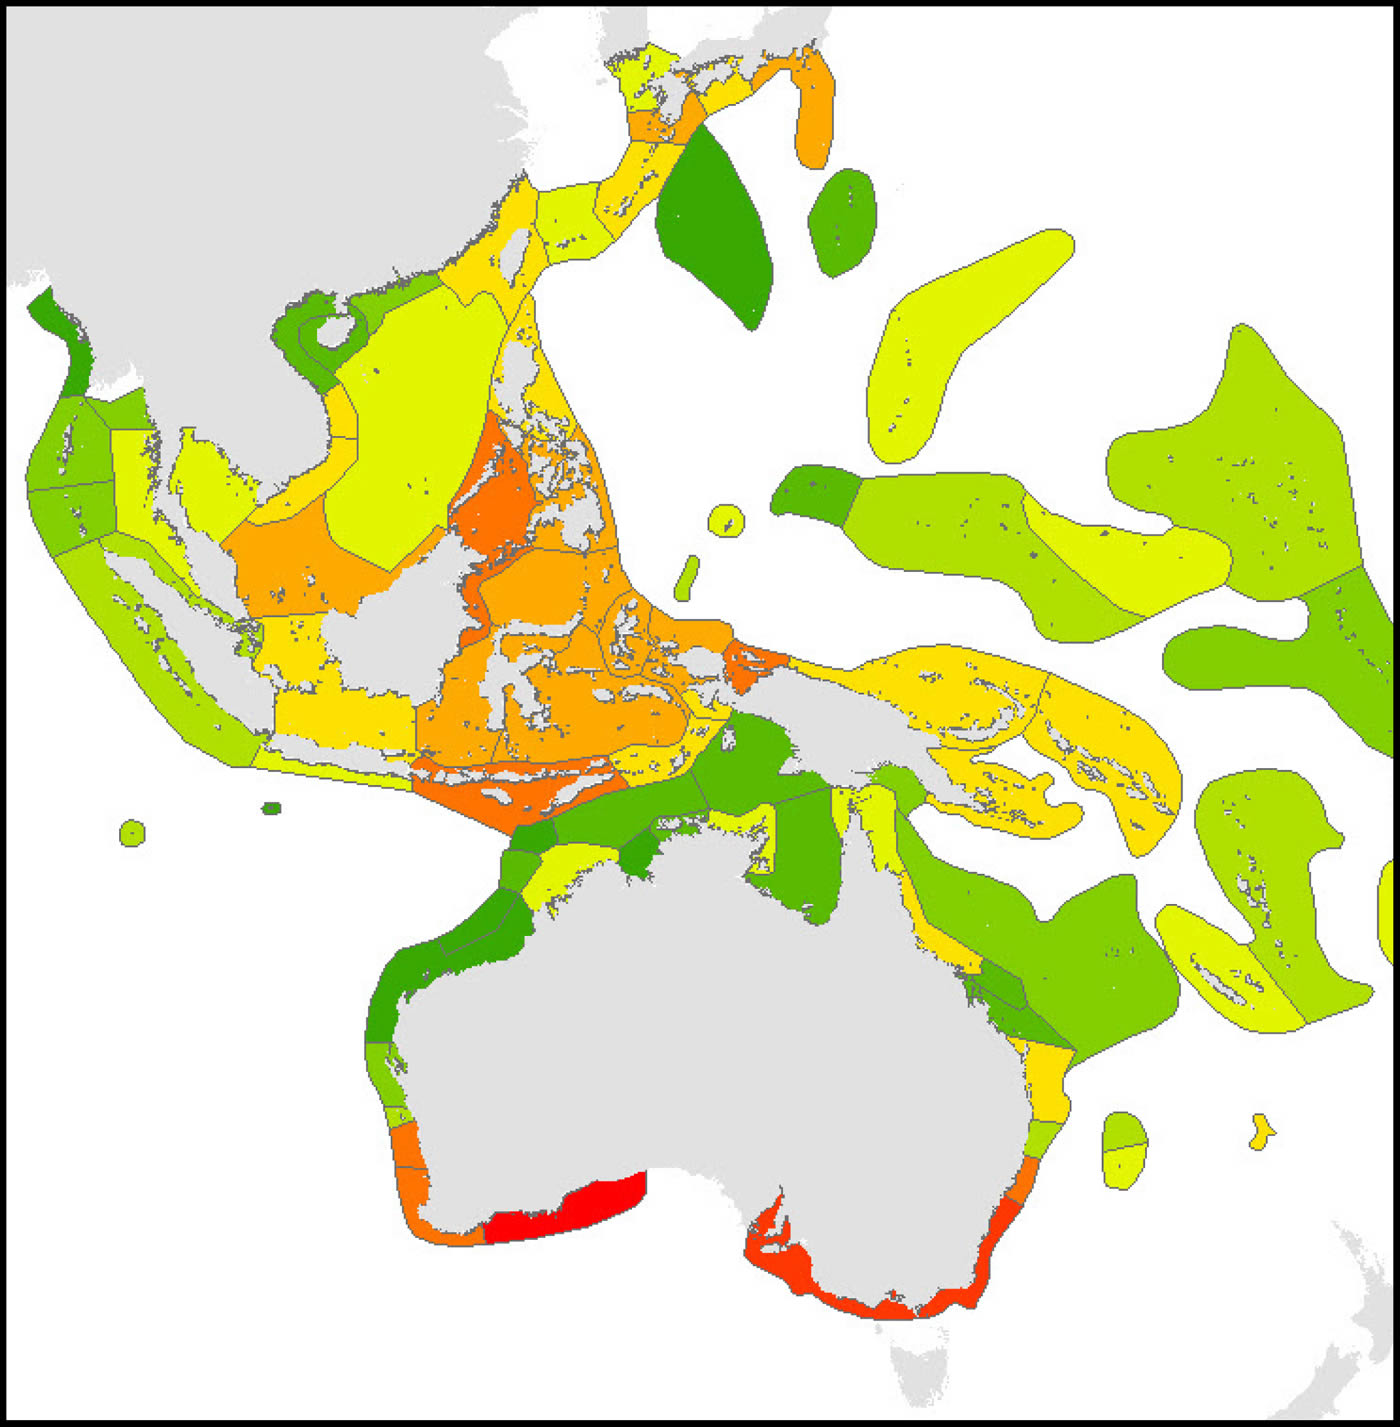
Endemism Index of central Indo-Pacific ecoregions calculated by the methodology of Kier and Barthlott (2001) and Crisp et al. (2001). Deep red = highest levels of endemism intergrading to dark green indicating no endemism, see text. It should be noted that the four highest levels of endemism within the Coral Triangle may reflect the amount of fieldwork that these areas have received. Figure 18.
Disjunct distributions
Most of the species recorded by Veron (1995) as having disjunct distributions have now been recorded in connecting ecoregions, but not all. For example, the exceptionally distinctive Catalaphyllia jardinei is known from the northern Philippines but nowhere further north except Kushimoto, mainland Japan. More recently Stylophora kuehlmanni Scheer and Pillai, 1983 and (less convincingly) Stylophora danae Milne Edwards and Haime, 1850 have all been reported in the Philippines (Licuanan and Capilli, 2004), species previously known only in the western Indian Ocean where they are distinctive. Most such occurrences are likely to reflect relict distributions; others may be due to recent dispersion or missing records.
High latitude ecoregions
In general (and except for the central and southern Pacific), ecoregions in high latitudes have less similarity with their nearest neighbour than ecoregions of the tropics.
Northern Indian Ocean. There is little or no development of consolidated reefs in all these outlying ecoregions (Persian Gulf, Gulf of Oman, Gulf of Kutch, Bangladesh, north Myanmar and Gulf of Martaban) and species compositions are mostly made up of those that are both widespread and commonly found in high latitude locations elsewhere plus a small number of regional endemics. All species in these ecoregions occur in reef as well as non-reef habitats.
High latitude Australia. There is no reef development in high latitude ecoregions, described below. The coral fauna of these ecoregions form a distinct group (not illustrated) which have closest affinity with that of the Kermadec Islands where there is also little or no reef development.
High latitude Japan. There is little or no consolidated reef development in the ecoregions of mainland Japan, see below and the coral fauna is strongly differentiated from ecoregions to the south. Except for the presence of endemic species this fauna has closest affinity with high latitude fauna of Australia (not illustrated, see amphitropical distributions above) and has more distant affinities with low diversity ecoregions of the central Pacific although this association is tentative.
Discussion
The long history of development of Coral Geographic to its point of publication has created significant issues for both users and the present authors. The necessity of delineating the Coral Triangle before the amalgamation of all relevant records was completed, let alone published, has meant that the process has had to be reiterated here. Likewise, IUCN’s production of a coral Red List (Carpenter et al. 2008, co-authored by three of the present authors) went ahead of necessity using unfinished mapping. It is now common to see two maps of the same species being compared (for example by Brainard et al. 2011) when both are re-worked versions of the same original maps accredited to different sources. In fact digitised versions of Veron (2000a) maps were shared with those authors who asked for them and re-digitised by others who didn’t. Some authors have considered these maps to be public domain information and others, with minor modification, have claimed them to be their own work. Given the level of taxonomic knowledge and the effort required to build detailed species maps (described in the Introduction, Acknowledgements and below) the difference between these categories is readily apparent.
Two points of general concern remain that seriously affect the data quality of all recent coral biogeographic publications. The first is that the thumbnail maps of Veron (2000a) reflect coral biogeography and taxonomy of the late 1990s. Therefore they do not include most studies relevant to the Coral Triangle, nor any species revealed by molecular techniques, nor any fieldwork undertaken during the past fifteen years. The second is that of the spectrum of information offered by websites, the maps of the Ocean Biogeographic Information System (OBIS) contain a high proportion of unsupported records from undisclosed sources and often do not include key records such as type locality. Coral Geographic does not give credence to a website production of the Australian Institute of Marine Science (AIMS) obtained from OBIS or to Hughes, Connolly and Keith (2013). The faunal provinces of Keith et al. (2013), derived from “detailed maps” of Hughes, Connolly and Keith (2013) are unrecognisable.
Several authors have claimed higher diversity than we have recorded for individual ecoregions based on biased use of taxonomic literature, unverified records and inclusion of synonyms.
Regional studies
On regional scales many biogeographic publications are nothing more than ‘armchair’ repetitions of records from pre-existing sources with little or no value added, a process now enormously aided by data accessibility via the internet. Others are insightful and detailed, reflecting substantial original work. The data used in the latter studies have been shared with us, see Acknowledgements.
Indian Ocean
The early biogeography of corals focused on the Indian Ocean more than any other part of the world, presumably because knowledge of the existence of the Coral Triangle has been a relatively recent development. In a review of the formidable array of the literature of his time, Scheer (1984) found three incremental phases in data development: (1) isolated generic compilations before Wells’ (1954) review, (2) the generic compilations of Rosen (1971) and (3) regional compilations after Rosen. However, it was Sheppard’s (1987) study based on compilations of species synonymies that produced the first true measures of regional affinities, a study which essentially supported the main conclusion derived from earlier generic contour maps, that there is a high level of contiguous distribution across the Indian Ocean with peak diversity located somewhere in the western southern hemisphere. We now know that the Red Sea almost shares that position, but this study is in agreement with the notion that there is not much provincialism in the Indian Ocean. Obura (2012) has revisited this subject using a fine data grid of surveyed locations south of the Red Sea. His conclusion that the northern Mozambique Channel has the highest diversity is supported by the present study (which includes Obura’s records) although patterns of affinity surrounding it may be different.
The Red Sea has a higher than previously recognised species diversity and the highest level of endemism for any species-rich ecosystem in the Indian Ocean. The affinities of ecoregions of the Red Sea region are statistically robust as the region is self-contained by its constricted entrance. The corals and reefs of the Persian Gulf are well documented (most comprehensively by Riegl and Purkis, 2012), central aspects being the notoriously harsh temperature extremes of Persian Gulf waters, severe human-induced degradation and the fact that the region is only flooded during inter-glacial cycles. It should be noted that reef-like (but basically unconsolidated rubble) accumulations are largely confined to the south-east and that the separation of the Persian Gulf and Gulf of Oman significantly depends on where the ecoregion geographic boundary is placed.
The reefs of the east Somali coast are poorly known; most records used in our analysis being predicted, not confirmed (see Methods) although a repeat analysis with lesser constraints on predictions does not change the pattern of affinity shown here. The same cannot be said of the Seychelles (especially the southern Seychelles) and the Mascarene Islands, both of which are likely to have more species than currently recorded. Eastern Madagascar is also poorly known although there is little reef development. In contrast, the north and north-west coasts of Madagascar are confirmed as the western Indian Ocean centre of diversity alluded to in early publications.
Central Indo-Pacific
The coral fauna of Australia, the Coral Triangle and Japan has been studied in detail and has been at the core much of the original fieldwork supporting this overview. As there has been an extensive array of original publications and reviews about these ecoregions (see Introduction and below) only discussion of new broad-scale findings are noted here. One such finding is that the global centre of biodiversity originally attributed to the Birds Head of western New Guinea now includes the Sulu Sea ecoregion. This may be an artefact of the timing as work on the Bird’s Head has not been updated since 2003 and a significant number of undescribed species are now known to occur there. Huang et al’s. (2014) finding of extreme diversity for the “South China Sea” is not comparable as it overlaps 12 of our ecoregions of which 3 are in the Coral Triangle. Of more relevance to the Coral Triangle Initiative, the Sunda Shelf qualifies for inclusion in the Coral Triangle on present criteria and the Java Sea is borderline for inclusion.
Western and central Pacific Ocean
The study of Wells (1954) of the corals of the Marshall Islands has had a dominant influence on much of the early taxonomic publications of this region, including the extensive work (published and unpublished) of Maragos especially from the Marshall Islands to Hawaii and the northern Line Islands, and Randall (also published and unpublished) from the Marianas Islands to Micronesia. It has been a challenge, for all those concerned, to amalgamate all species in these studies within the taxonomic framework of Corals of the World as it is often not possible to simply replace one name with another. The extensive collections of Randall, currently being revised, are likely to assist this amalgamation.
Polynesia and the central Pacific
This is the least well known of all the major provinces. Much of the data presented here, with the exception of American Samoa, Hawaii, Johnston Atoll and the Phoenix Islands has been obtained from photographic and museum collections. As previously noted, inventories of remote island groups are likely to remain dissimilar as all are isolated and there are significant taxonomic issues with many species. This effort has been significantly aided by recent collections and photography of the corals of the southern Line Islands.
Far eastern Pacific
The question as to how Pacific corals crossed the vast emptiness of the Eastern Pacific Barrier was once much debated until their capacity for long-distance dispersal was recognised. Nevertheless, the separation of the coral faunas west and east of the Barrier is deep, strongly indicating that ocean crossings are very rare events (except for Pocillopora and some other species) where corals are rafted on floating objects (Jokiel, 1990 and subsequent publications). Of the ecoregions indicated in the relevant map, those of Hawaii and Johnston Atoll as well as the Far Eastern Pacific have been well studied, and recent accounts of the biogeography of the province by Glynn and Ault (2000) and others are in general agreement with this study. Likewise is Glynn et al.’s (2007) account of the biogeography of Easter Island corals.
The Atlantic Ocean
The biogeography of this province is well known; the present study confirming previously described patterns.
The future
Irrespective of data sources and the taxonomic issues that accompany them, the basic question that arises with any biogeographic study is ‘how closely do the results presented describe the real world’? Our data, in keeping with other field studies of corals, shows that a high proportion of corals are very widely distributed, so widely that genetic cohesion over such a range must be exceedingly weak. Most species of corals show this; it underpins reticulate evolution and the morphological, genetic and geographic fuzziness this concept embraces. Future developments in coral biogeography will increasingly take in molecular determination of species, especially of genera which have species that are difficult to separate morphologically. The latter are highly dependent on the co-occurrence of the species in question whereas molecular studies have no such constraint and will therefore be particularly informative about the diversity of isolated ecoregions, especially those of high latitudes.