Distributions, diversity and endemism
Distributions, diversity and endemism
Patterns of diversity
The pattern of diversity at family level is mostly a matter of distant geological history as seen in the fossil record. That is, it reflects a time in the distant geological past when the presence of the Tethys Sea and the Central American Seaway led to a uniform circum-global fauna. At this taxonomic level, there is no well-defined Indo-Pacific centre of diversity and the Caribbean is almost as diverse as the Indo-Pacific. With continuing major family-level taxonomic revision taking place, coral family names are not generally included on this website.
Contours of family diversity. From Veron (2000a) Corals of the World. Figure 1.
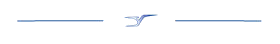
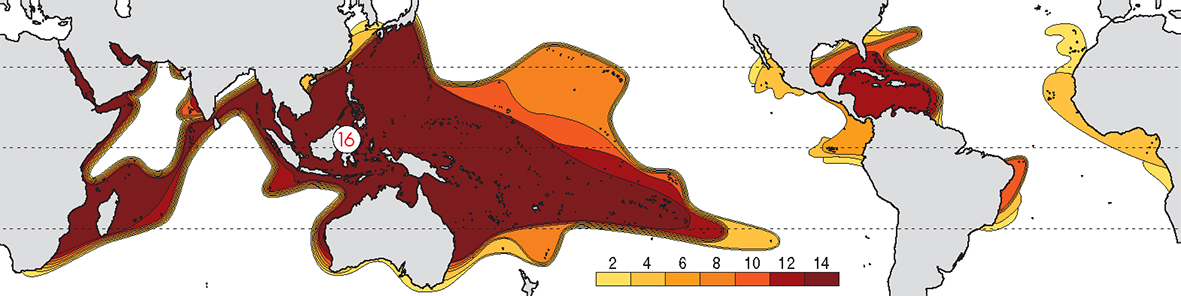
The pattern of diversity at generic level is primarily created by the many taxa that evolved in the Tethys Sea and which now survive only in the Indo-Pacific, together with genera that evolved in, and remained in, the Indo-Pacific. At this taxonomic level there is a well-defined Indo-Pacific centre of diversity and the Caribbean has a substantially lower diversity than the Indo-Pacific. From the central Indo-Pacific there is relatively little attenuation of diversity west across the Indian Ocean, but a regular attenuation occurs east across the Pacific.
Contours of generic diversity. From Veron (2000a) Corals of the World. Figure 2.
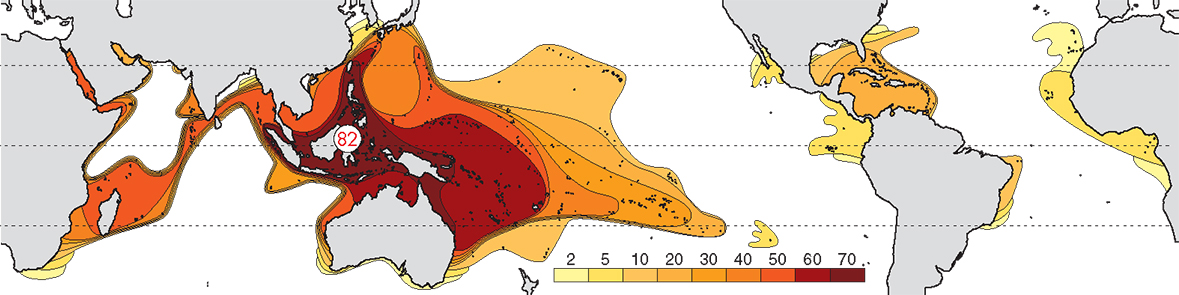
The pattern of diversity at species level is primarily the outcome of ocean circulation patterns and resulting geographic and evolutionary changes from the Plio-Pleistocene to present time. There is a well-defined Indo-Pacific centre of diversity, the so-called ‘Coral Triangle’ (see below, Veron, Stafford-Smith, DeVantier et al., 2015 and the Overview of coral distributions for further detail). This centre attenuates progressively in the north along the Ryukyu Island chain of Japan and in the east across the Pacific and to the south down both sides of Australia (see below). Within the tropical Indian Ocean, species diversity remains approximately uniform. The diversity of the Caribbean is no more than that of a depauperate outlying location of the Indo-Pacific.
Contours of species diversity. From Veron, Stafford-Smith, DeVantier et al., 2015. Figure 3.

Hotspots of biodiversity and endemism
‘Hotspot’ is a term frequently used by conservation biologists to denote a relatively restricted geographic area containing exceptionally high levels of biodiversity and/or endemism, a concept that has been effective in prioritising conservation activities where resources are limited. With more than 80% of all the species of the Indo-Pacific, the so-called ‘Coral Triangle’ (see below) is clearly the centre of Indo-Pacific coral diversity, with additional smaller centres in Madagascar and the Red Sea/Arabian Sea.
Diversity may be the result of a high level of endemism or the overlap in the ranges of species with wide ranges. At overview level, the Red Sea (with 7 endemics, or 2.1% of the total) has the highest level of endemism in the Indian Ocean. The Coral Triangle as a whole, with 21 endemics, or 3.35% of the total, has the highest level of endemism of all diverse ecoregions in the world although (as Veron, 1995a noted), the diversity of the region is primarily due to the overlapping of large species ranges as opposed to the presence of large number of endemics (Veron, Stafford-Smith, DeVantier et al., 2015).
Patterns of endemism are created by isolation; either geographic distance (locations remote from centres of diversity), or geographic enclosure. It is a complex issue to address in corals and other taxa that may be widely dispersed because it requires knowledge of where a species does not occur as well as were it does.
Coral Triangle
The Coral Triangle is an area of more than 6x10⁶ km2 of ocean territory of Indonesia, the Philippines, Brunei Darussalam, Malaysia, East Timor, Papua New Guinea and the Solomon Islands. The highest species richness resides in the Bird’s Head Peninsula of Indonesian Papua, which hosts around 570 species, with individual reefs there and in adjacent Halmahera having up to 280 species ha-1 (DeVantier and Turak, 2017), over four times the total zooxanthellate scleractinian species richness of the entire Atlantic Ocean. Within the Bird’s Head, the Raja Ampat Islands have the highest diversity at 567 confirmed and strongly predicted species (see Coral Geographic interactive map').
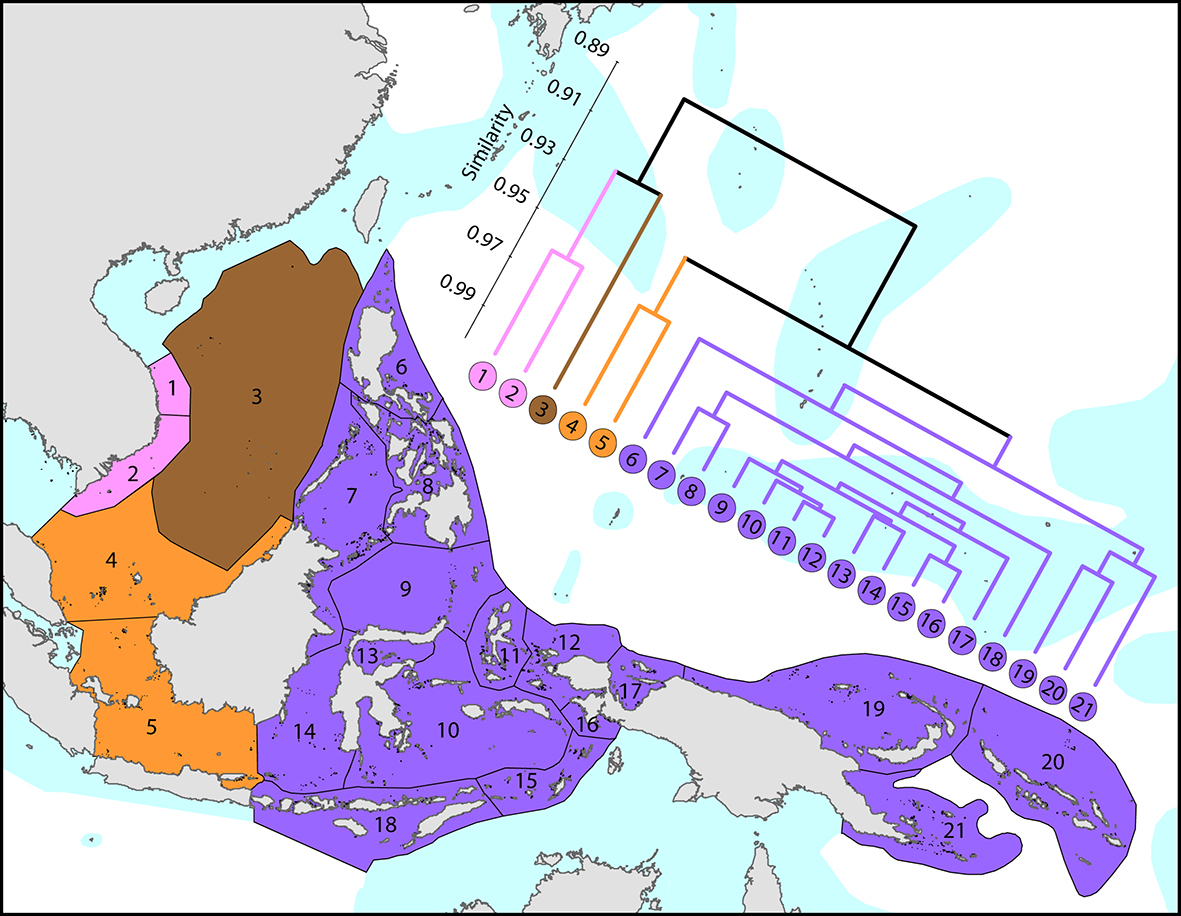
Affinities between the Coral Triangle and those of adjacent ecoregions. From Veron, Stafford-Smith, DeVantier et al. (2015). Figure 4.
Importantly, the boundary of the Birds Head diversity centre is not strongly delineated, nor is this region markedly distinct from neighbouring ecoregions to the south and east. Ninety-five per cent of Coral Triangle species are found in one or more adjacent ecoregions (notably other parts of SE Asia - including Malaysia, Thailand and Vietnam, Micronesia, the northern Great Barrier Reef, Vanuatu, New Caledonia and Fiji) although all exhibit marked declines in species richness and ubiquitousness.
Habitat diversity is clearly the key to the reason why the Coral Triangle is so diverse; however there are other semi-independent explanations. The fossil record suggests that the corals of the Coral Triangle are the world’s youngest – less than half the mean age of their Caribbean counterparts. These relatively young genera either evolved in the region of the Coral Triangle or have survived there since going extinct elsewhere. The region of deep water in close proximity to reef areas provides minimal dislocation during times of rapid sea-level change.
More proximal explanations for the diversity of the Coral Triangle are (1) the region acts as a ‘catch-all’ for larvae moving westwards across the Pacific Ocean in the South Equatorial Current resulting in an overlap of Pacific and Indian Ocean species, (2) temperatures are at global maxima, (3) conditions for reticulate evolution are optimal and (4) complex eddies created by the Indonesian Through-flow drives genetic mixing which constantly changes with sea level.
Regional similarity
Distribution maps allow measures of regional similarity to be calculated which take into account not only the number of species, but also the identity of those species. The result is intuitive: the broad pattern of similarity among regions primarily reflects their degree of geographic proximity. Atlantic corals are very distinct from Indo-Pacific corals. The Caribbean/Gulf of Mexico is a distinctive region, with the corals of Bermuda and the east American coast most closely allied to it. In the Indo-Pacific, the far eastern fauna is also very distinctive. To a lesser extent so also are the corals of the Red Sea. The least distinctive are the regions of the central equatorial Indo-Pacific.
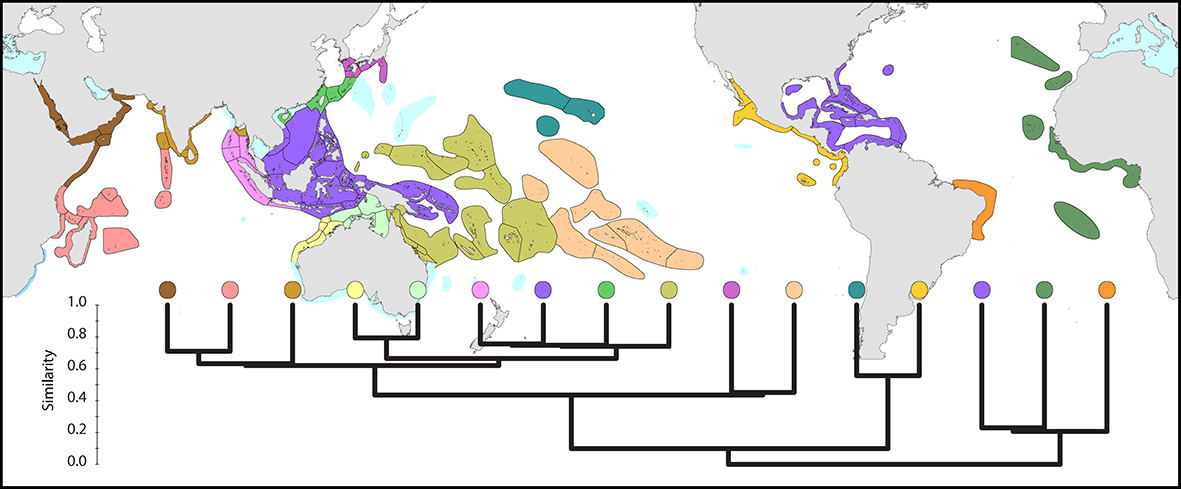
Global affinities. Similarity between the main coral biogeographic regions of the world, calculated from species distributions. From Veron, Stafford-Smith, DeVantier et al. (2015). Figure 5.
Latitudinal attenuation
A few high latitude endemics notwithstanding, tropical species are not generally replaced with subtropical species as latitude increases, but rather there is a gradual attenuation (thinning out) of tropical species. This is correlated with decreasing temperature, but it is also correlated with seasonally reduced illumination and the poleward direction of the main surface currents. What the currents do is perpetually move planulae away from the equatorial centre of diversity to higher latitudes. This creates a ratchet effect: the corals can go in one direction only as there is no return. Subtropical locations are thus genetically connected to tropical locations, but not the reverse. This makes it possible to ‘lock up’ corals in high-latitude regions and this is the probable reason why there are a large number of geographic subspecies found at high latitudes.
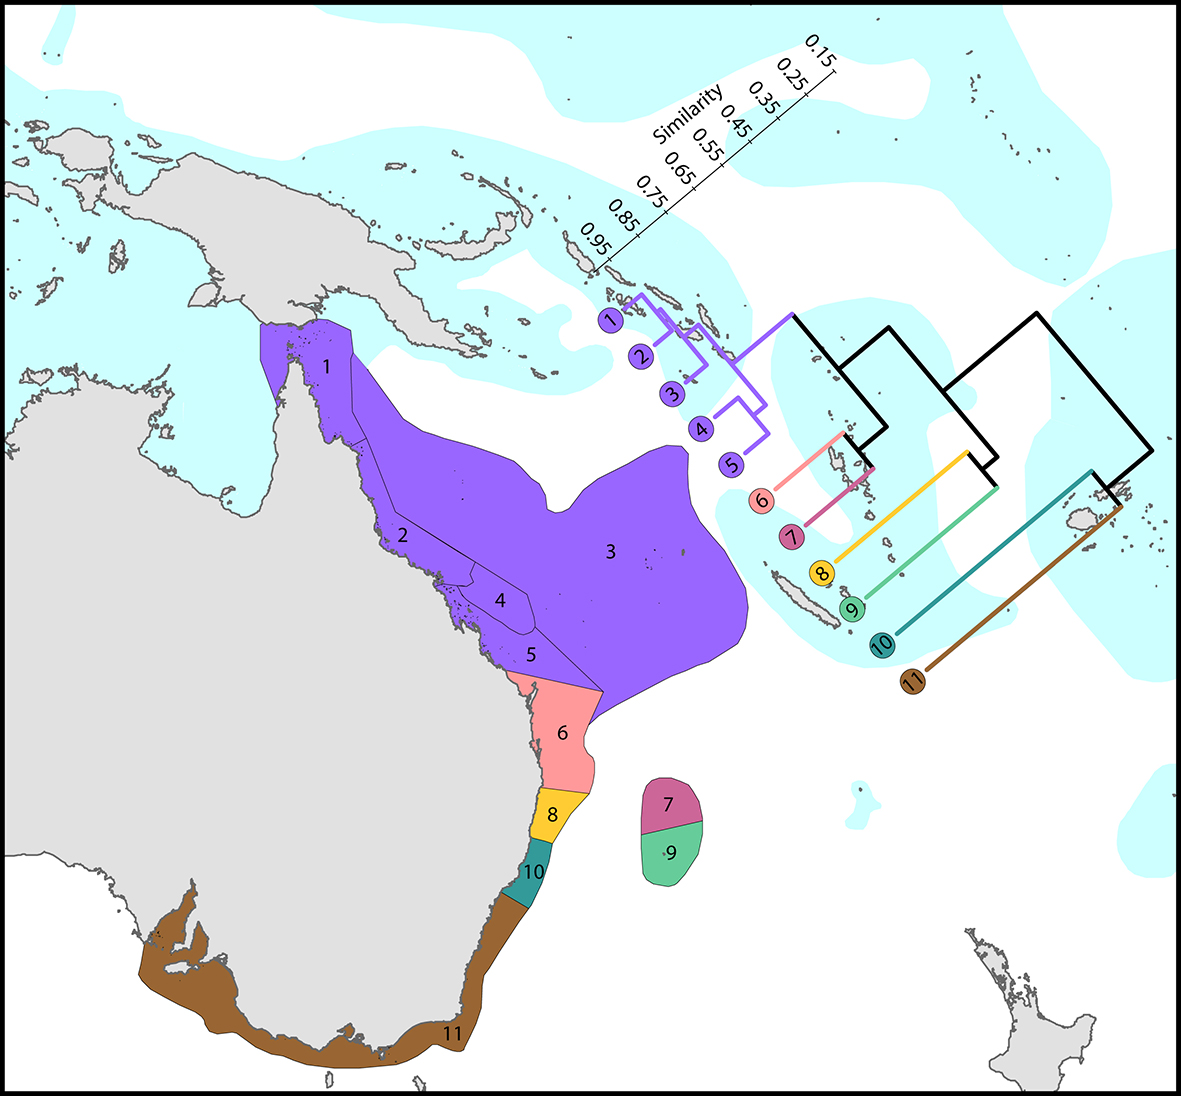
Regional affinities along eastern Australia. There are three main biogeographic zones: tropical reefs, subtropical communities and high latitude depauperate communities. The surface current shown is the core of the East Australia Current. From Veron, Stafford-Smith, DeVantier et al. (2015). Figure 6.
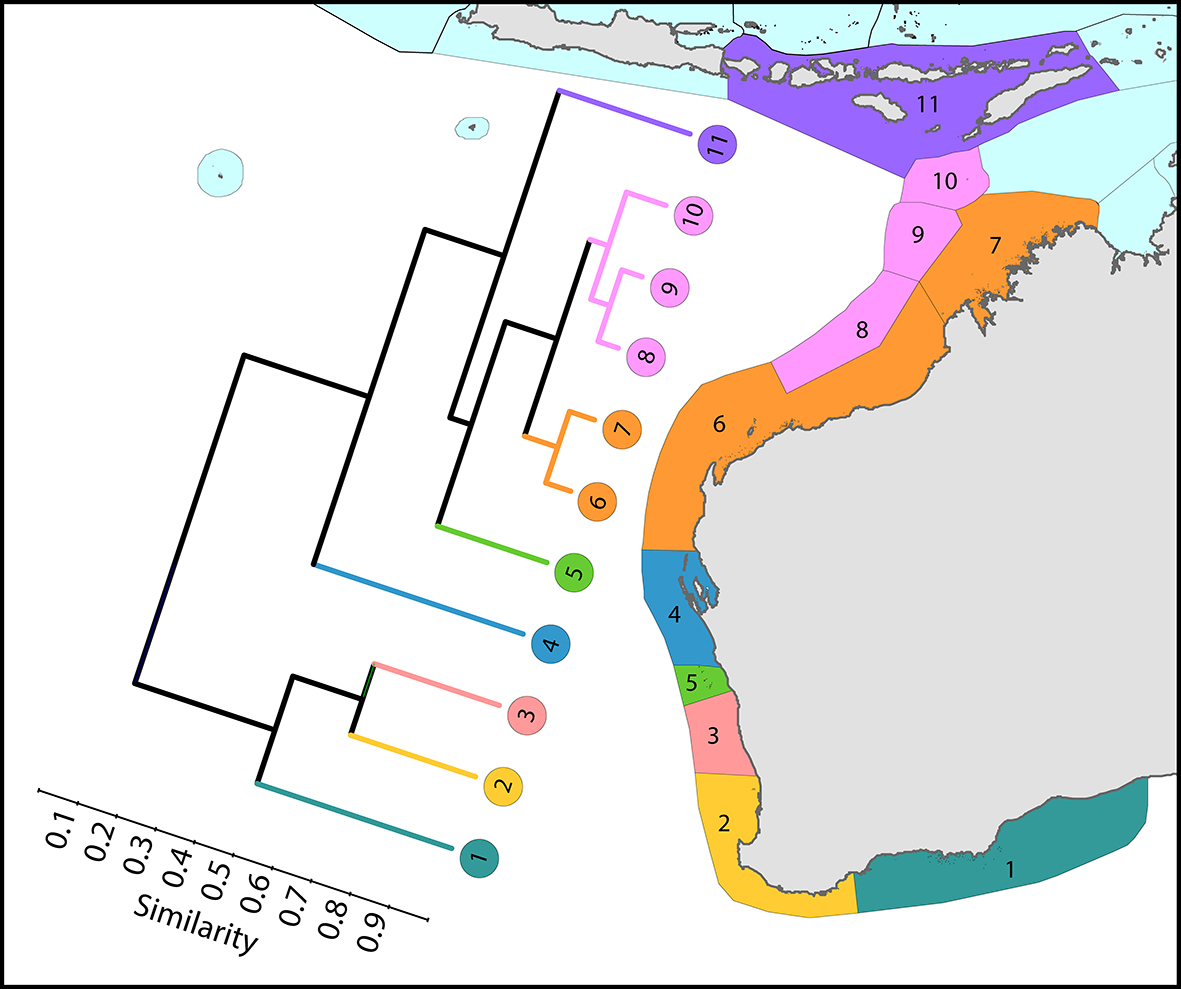
Regional affinities along western Australia. There are two main biogeographic zones: reefs and non-reef communities. The surface current shown is the core of the Leeuwin Current. From Veron, Stafford-Smith, DeVantier et al. (2015). Figure 7.
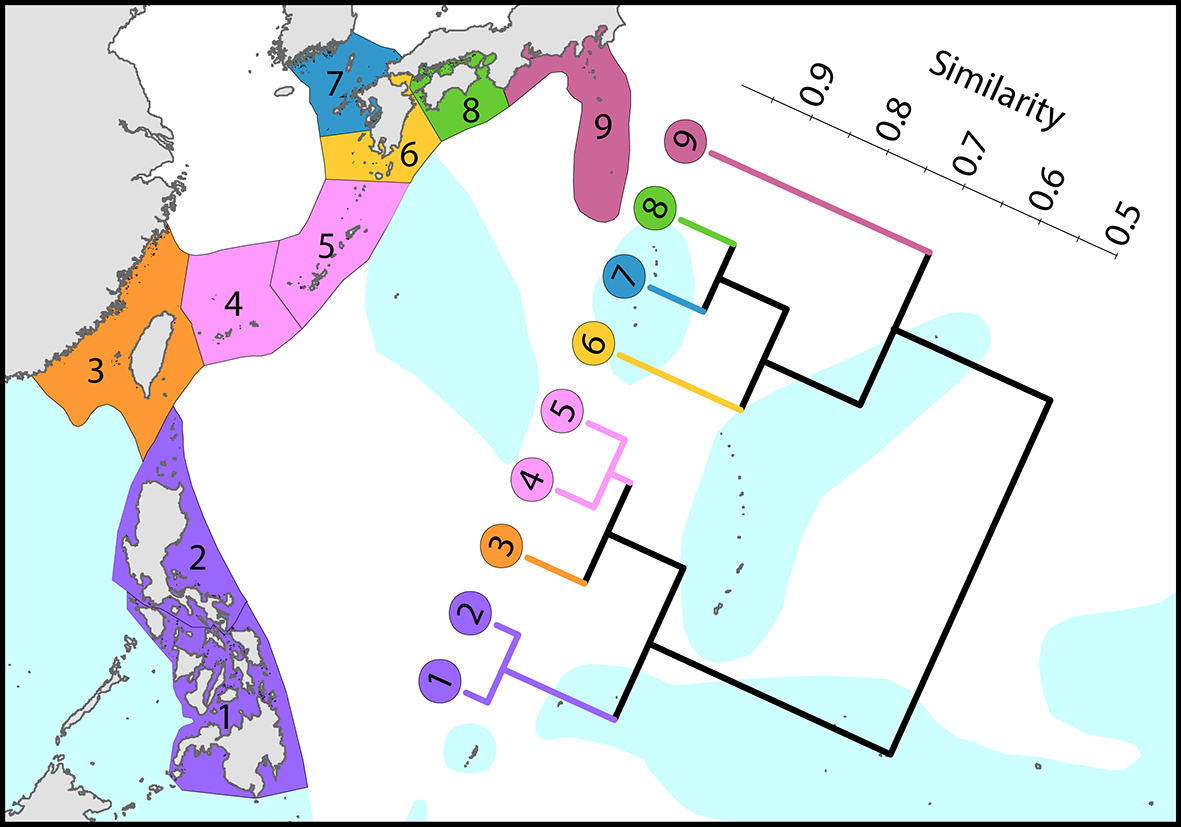
Regional affinities from the Philippines to Japan. There are three main biogeographic zones: tropical reefs, subtropical non-reef communities and temperate (high latitude) depauperate communities. The surface current shown is the core of the Kuroshio. From Veron, Stafford-Smith, DeVantier et al. (2015). Figure 8.
These patterns also show that there is usually a substantial difference in species diversity between reef and non-reef communities. This is not directly related to temperature. The majority of corals can tolerate water temperatures as low as 14°C for protracted periods of time, but corals can only build large consolidated reefs if the temperature normally stays above 18°C. Rather, it is related to the capacity of corals to out-compete macro-algae. In effect, coral species act cooperatively to create habitats which will support a diverse coral community (see Controls on reef development and Reef environments).
Explanations of distribution patterns
Corals, more than any other group of marine invertebrates, have attracted the attention of marine biogeographers. This is partly due to the interest created by Darwin’s 1842 book about coral reefs and subsequent debates about some of the issues it raised, but also because of the obvious concentration of both corals and reefs in tropical locations. The result has been a progression of publications which contain contour maps giving various revisions of generic-level maps. A wealth of hypotheses have been put forward to give evolutionary explanations for these maps.
The explanation of distributions is best understood as a progression of layers of detail. Family-level distribution provides the ancient basic template. This pattern is the present-day remnant of major global geological and climatological changes, especially continental movements and major extinction events. Super-imposed on this is the generic-level template. This ‘inherits’ the family-level background but is largely the outcome of more recent geological events, especially the obliteration of the Tethys Sea and the closure of the Central American Seaway. Super-imposed on this again is the species-level pattern. This ‘inherits’ the generic pattern but is largely the outcome of Pliocene to modern climates and their effect on ocean currents, notably their respect effects on reticulate evolution.
Control of diversity and dispersion To a large extent, outlying areas of the Pacific have subsets of the species of the centre of diversity: most peripheral patterns are therefore the result of outward dispersion from that centre, they are not the result of evolution by regional isolation.
There are essentially two reasons why there is an Indo-Pacific centre of diversity. The first is due to currents. The main currents of the equatorial Pacific flow in a westward direction to the centre, which therefore acts as a catch-all for planula larvae. The second is due to habitat diversity. The centre of diversity is the world’s largest tropical archipelago of islands, the Philippines and Indonesia, containing 37% of the world’s coral reefs. These islands have convoluted coastlines offering a wide range of habitats, all in close proximity. Their habitats are closely linked by variable currents. Species diversity is maintained by habitat diversity and habitat accessibility: again, this diversity is not an outcome of regional evolution, although there are some regional endemics, as noted above.
There is a balance between species diversity and dispersal capability, a balance maintained or changed by ocean circulation patterns. If currents weaken, diversity will appear to increase because genetic isolation increases, creating many pockets of semi-isolated taxa which are more or less distinct from their relatives depending on the period of isolation. If currents strengthen, diversity will appear to decrease because genetic isolation decreases, causing taxa to become widespread through genetic intermixing. These (fewer) taxa may also become relatively well defined if the period of mixing is long enough.
In effect, changing currents cause genetic diversity to be endlessly ‘repackaged’ from large numbers of relatively isolated taxa into smaller numbers of relatively widespread taxa, then back again. This occurs in cycles that have variable impacts and frequencies. Substantial biogeographic change may occur at intervals of thousands of years or less and these may be associated with sufficient repackaging to form geographic races or varieties. Major cycles, or the additive effects of many cycles, may create species-level distinctions.
Dispersal of most terrestrial animals is an active undertaking. It requires a capacity for mobility, it allows choice of direction, and there is a high probability of surviving the journey. Dispersal of most marine animals is passive: it is controlled by ocean currents. It requires little effort, there is no choice of direction, and there is a low probability of survival. For these reasons, most dispersal on land is undertaken by adult animals, whilst in the ocean dispersal is usually undertaken by larvae. Reproduction and dispersal, for most marine animals, are therefore closely linked subjects. Only some larger vertebrates — oceanic fish, reptiles and mammals — are able to defy the currents and undertake active dispersion. For the rest of marine life, the pathways of dispersion cannot be controlled, or (except for timing) even selected for. This has enormous significance for all aspects of coral biology, including taxonomy and evolution.
Principal global circulation patterns today. The main currents illustrated are the highways of dispersion, but there are many other pathways created by regional detail and seasonal, annual and long-term variations. All but the greatest of these currents are subject to changes associated with climate, tectonic alteration of coastlines, and fluctuations in sea level.
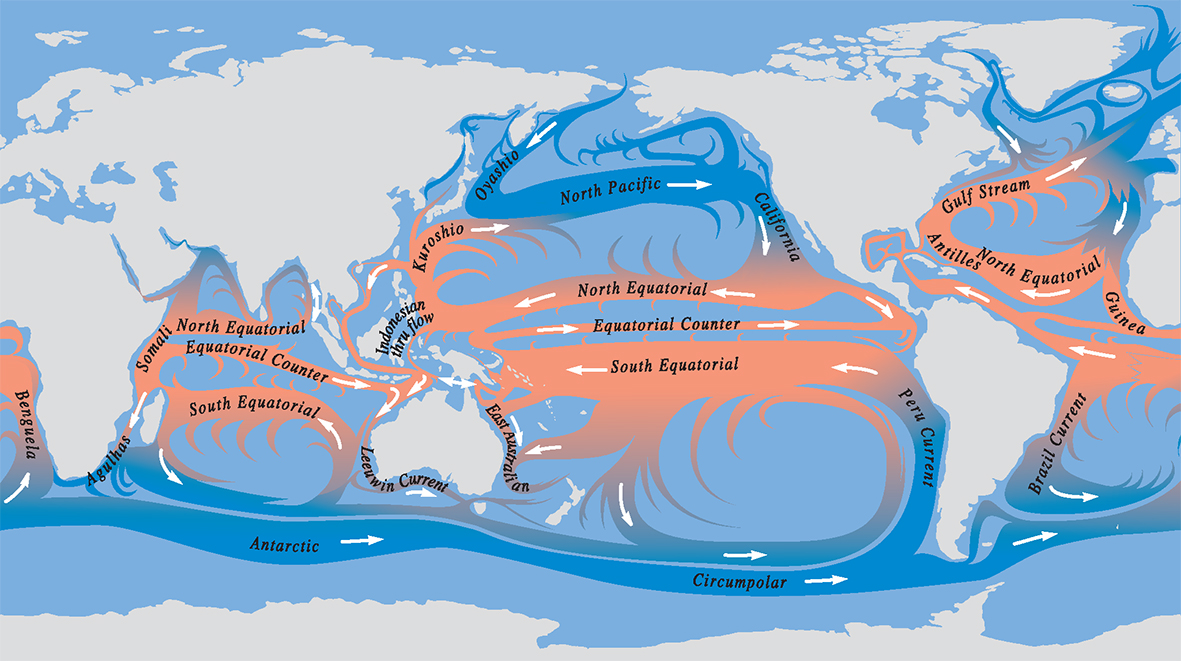
Principal ocean currents. From Veron (2000a) Corals of the World. Figure 9.
Because most marine organisms (including corals) are dispersed by larvae, the paths of the currents are the paths of gene flow – the paths of genetic connections. Currents are largely responsible for creating, and breaking, the distribution ranges of species. For most species, these ranges are very large, so large that the genetic composition of a species in one part of the range may be very different from that in another. For corals, as with many other major groups of plants and animals, this variation in genetic composition reaches a point where variation within species merges with variation between species. When this happens, geographic patterns are created where the morphological boundaries of species (the limits to what a taxonomist might call a species) become arbitrary.
Importantly, distribution patterns are the outcomes of dispersal by currents: not just the currents of today, but all the currents that existed during the evolutionary history of the species.
Distribution ranges of individual species In the Atlantic, most coral species have pan-Caribbean distributions (for example Colpophyllia natans), and only a few are more widespread (for example Madracis pharensis), occurring off the west African coast and outlying island groups and/or in the Mediterranean Sea. Only very few species are restricted to smaller regions therein (for example Schizoculina africana).
In the much more species-rich Indo-Pacific, by contrast, the ranges of individual species vary widely. Some occur, in suitable habitats, across the entire Indo-Pacific region, from the northern Red Sea and east Africa in the west to Hawaii and the Pacific coast of Central America in the east (for example Gardineroseris planulata). Others are more restricted, occurring in smaller parts of this range, some with major disjunctions in their distributions (for example Leptoria irregularis). As introduced above, some are endemic to particular regions, notably the Red Sea, Coral Triangle or southern Australia (for example Erythrastrea flabellata).
Relative abundance Across each species’ distribution range, its local abundance may be relatively stable or can vary widely. Some species are common in most places where they occur, such as massive colony-forming Porites, two species of which, P. lutea and P. lobata, are the most common corals in the Indo-Pacific (DeVantier and Turak, 2017). Other species may be common in only a few parts of their overall distribution ranges, or rare in most places in which they occur. A few species are known from very few records in a single location. These differences determine the local and regional structure of coral communities and are also key aspects of conservation planning and management.
Further reading
For more detail on the issues summarised here, see Veron (1995a), Veron (2000a), and particularly Veron, Stafford-Smith, DeVantier et al., 2015 which can also be found as the Overview of coral distributions located under the main menu item Coral Geographic above.