Methodology and data limitations
Methodology and data limitations
Species distribution data
Background
Meaningful distribution data at species level is dependent on a globally coherent taxonomic framework combined with reliable identifications at site level. Each confirmed distribution point requires that a record, specimen or photograph can be reliably allocated to one particular species rather than another. This is seldom straightforward.
Coral species, like most life, are not conveniently packaged into well- defined units which are readily recognisable everywhere and by everyone. Instead, they are notoriously variable within and between habitats and much more so across their full distribution range. This can make identification a challenge even locally, let alone on the global scale of Coral Geographic.
The long and complex history of coral taxonomy adds a further human dimension of complications arising from contrasting assessments of 'type' specimens of the nominal coral species by different workers, leading to differing taxonomic interpretations and synonymies, all of which are bound to the present by rules of nomenclature, see Overview of Coral Taxonomy.
We are not immune from these issues - the taxonomic framework presented on this website is evolving rapidly and will continue to do so with the increasing use of genetics in taxonomy and phylogeny. For example, we have not ascribed genera to families at present because of the rapid and continuing proposed changes among coral lineages, some of which are conflicting.
These issues come into sharp focus for field workers. It takes a substantial investment of time, effort and resources to develop the skills necessary to discriminate between similar or cryptic species, to know these species well enough to recognise them wherever they occur and to produce consistent, reliable and meaningful accounts of them. All this is readily apparent to those of us who have spent years, in some cases lifetimes, working with corals. Even so, ensuring that the variant ascribed to a species by one researcher in a given part of the world falls within the boundaries of the taxonomic variability we attribute to that species within our taxonomic framework, has often required detailed and time-consuming confirmation and has frequently not been possible.
Importantly, however, this work is not simply a gathering and processing of published information. It is a compilation of our own work to which that of others has been linked. As detailed below, the research of our core team has been global in extent and has addressed all taxa at species level so has the advantage of providing a consistent background against which to assess the records from elsewhere.
Although species records have been examined at site-level wherever available, the overall reliability of such lists is very variable (particularly in relation to cryptic and lesser known species). To deal with this significant source of error, we have chosen to limit distribution records to their presence and absence in a suite of 150 Ecoregions for which we have much higher confidence. Distributions at finer scales will continue to be refined as records at these scales can be confirmed.
Even at ecoregion level there are more than 120,000 data points (›830 species x 150 ecoregions) and, for each of these we have between 0 and 50 or so records of some kind. Each record has been assessed to contribute to our confidence in the presence of a species in an ecoregion.
For certain records, unless there are specimens or images or we have detailed knowledge of the research program in question, there is no easy way of confirming conclusively whether or not the species name associated with the record directly relates to the valid species or entity defined within our taxonomic framework. This is not a reflection on the fieldworker, it is the reality we are faced with in trying to draw into a common taxonomic framework, the records of globally variable and difficult species from a variety of sources.
In our attempts to maintain the quality and integrity of the data presented, it has often been necessary to exclude or downgrade data (including our own) which we have been unable to verify adequately. Wherever possible we will rectify such omissions where further specimens, images or information can be provided for confirmation.
We are also aware that the result will be seen by some as representing the 'world according to Veron et al.'. To the extent that differences between taxonomists are resolved within the Veron et al. collective consensus, this is true, albeit following significant discussion and review of relevant literature, including original descriptions, by the team. But it is also a necessary part of providing a single coherent taxonomic framework from which to make comparisons. We have integrated the taxonomy and views of colleagues wherever possible, and have cited alternative views where integration has not proved feasible (see Taxonomic Notes in the Taxon Finder tool and in each Species Factsheet). Such decisions may be reviewed in the light of feedback to this website.

Scope of original studies by the authors
The data presented in this website are underpinned by a multitude of detailed studies undertaken by the authors from the 1970s until the present day, collectively representing more than 20,000 hours of diving. The spatial breadth of these studies extends almost around the globe providing the groundtruthing necessary to assess data from other sources and resolve conflicts that might otherwise have been overwhelming. Currently this includes (a) comprehensive studies in over 4500 sites in 50 ecoregions, (b) incomplete field studies targeting specific taxa in over 250 sites in 18 additional ecoregions and (c) transitory field observations in around 190 sites in 13 additional ecoregions. This fieldwork was sometimes undertaken concurrently by one of us with our associates on the same expedition and sometimes on different expeditions as time and opportunity allowed. In total, our coverage involved over 5000 sites in 85 of the world’s 150 ecoregions after separate studies in the same ecoregion are combined.
Each site typically involved between 1 and 5 scuba dives depending on the nature and extent of the work being undertaken. Where available, local knowledge and/or satellite imagery were used to help select sites of greatest diversity in unfamiliar ecoregions and additional sites were then selected to include habitats with different substrate types, depth, current regimes and levels of exposure to wave action. With rare exception, fieldwork was undertaken via expeditions specifically dedicated to taxonomic and abundance studies. Importantly, inter-observer taxonomic issues were minimised through shared fieldwork and extensive checking of specimens and underwater photographs.
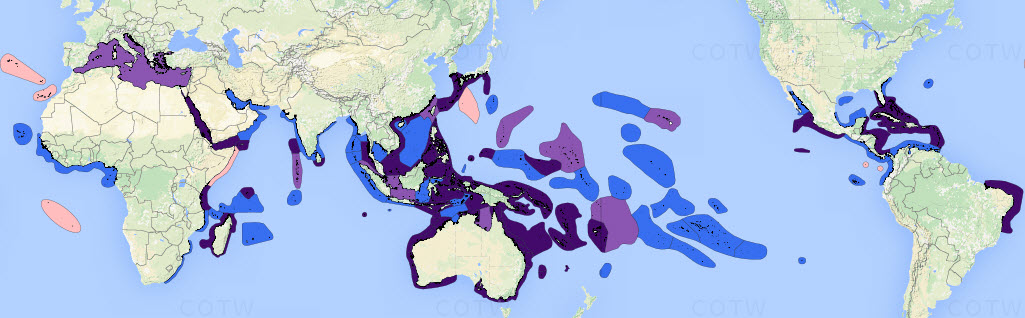
Distribution of original studies by the authors.Dark purple = detailed original field studies leading to species inventories, including extensive comparison with local collections; pale purple = original but incomplete field studies, mostly of specific taxa, augmented by studies of collections across all available taxa; blue = studies of collections; pink = unstudied ecoregions except for some specimens available from other collections. Figure 1.
Integrating distribution data from other sources
Distribution data from all available sources have been integrated into our databases. These sources include:
a) Taxonomic literature. Most monographs stemming from early expeditions of discovery provide little insight into coral distributions. There are numerous examples of suspect depths, highly unlikely localities, labelling confusions and other issues, which make reliance on reported locations problematic. Specimens were often bought in ports (recorded as, for example, Singapore) when in fact they were brought in from elsewhere by passing sailors. However, many studies from last century, and particularly since the advent of in situ research, provide good geographic records and in total over 1000 taxonomic publications have contributed to Coral Geographic.
b) Biogeographic literature. Reports of coral diversity in specific regions are (with exceptions) small in terms of number of publications and are variable in quality, ranging from lists of species occurrences from previous studies and museum records (‘armchair biogeography’) to detailed original research. In principal, species names in any biogeographic publication are only useful if they can be confidently associated with species that are recognisable in the field and/or with specimens collected for this purpose. Species which are not thus recognisable (unstudied ‘nominal’ species), records which are not new or newly confirmed, or those which might have extended ranges had they been adequately documented, are not included in this website.
c) Ecological literature. Studies involving individual species or groups of species in surveys of mass bleaching, Acanthaster outbreaks, disease, reproduction, physiology and other species-specific research have been taken into account where the authors are known to have appropriate identification skills.
d) Collections. Veron’s own collection of approximately 28,000 specimens originally held at the Australian Institute of Marine Science and subsequently moved in part to the Museum of Tropical Queensland, Australia mostly consists of voucher specimens of species under taxonomic review (collected from ecoregions shown in dark purple in the map above) as well as extensive contributions from colleagues relating to other ecoregions. However, since the mid-1990s, restrictions due to the Convention on International Trade in Endangered Species (CITES) have made such specimen transfers increasingly problematic and many collections remain in their country of origin even though some have no facilities for their long-term curation.
Coral collections in 48 museums and research institutions were studied for both taxonomic and biogeographic purposes, see Acknowledgements. Collections specific to well-studied regions, especially in the Philippines, Australia and Japan, have proven particularly valuable for such purposes.
e) Photography. In situ photographs of some genera, notably Porites and Montipora, are often unhelpful for species recognition, but many records of other taxa have been suggested or confirmed with photographs. Photographic collections of about 120 photographers and research workers have been studied for this purpose with the number of identifiable photographs from each varying from one to hundreds.
f) Personal communications. This has been an extensive and much valued source of records and verification of records, see Acknowledgements.
Reliability and bias within distribution data
Certain facets of our distribution data that affect the analyses presented in publications and elsewhere in this website can be found in the Overview of Coral Distributions. Here, we combine all aspects to provide guidance for the user who wishes to understand the data more deeply. Note that many of the issues below are interlinked.
Taxonomic issues
Meaningful distribution data at species level are fundamentally dependent on the distinction of one species from another, such that they can be reliably identified in the field and from specimens linked to fieldwork. In this respect, not all valid species are equal.
Taxonomic robustness
Taxonomically robust species come in different categories. A few species are distinct on all levels: they are accurately recognised from fossils; they do not vary much in the field either locally or globally and they are distinct from all other species with which they co-occur. The best known example is Diploastrea heliopora. Others, like Pavona maldivensis, may have substantial variability (hence a complex taxonomic history) but now have few taxonomic issues because they have consistently distinctive characteristics which set them apart.
At the other end of the scale, there are a number of accepted species which are species complexes . For these, some of the confusions over identifications in the field may be due to the presence of cryptic species, or ‘hybrids’, or the complexities of reticulate evolution discussed by Veron (1995a). Porites lobata and Pocillopora damicornis are examples of accepted species which could more accurately be described as species complexes.
A majority of accepted species lie somewhere between these two extremes but most have fuzzy boundaries, a natural and unavoidable consequence of reticulate evolution, various forms of genetic mixing and the geographic patterns they create. Indications of where particular species lie on this spectrum can often be found in the taxonomic notes, and more detailed summaries will be available in later updates with taxonomic robustness categories and commentaries.
Taxonomically robust species, with a few exceptions, tend to have more comprehensive distribution data because, throughout their history, there has been less confusion.
Taxonomic history
Date of acceptance. Irrespective of whether or not an accepted species forms a species complex, the year in which it was described or resurrected has a strong influence on the availability of reliable distribution records. Thus, recently described species, or old species that have only been recently accepted or re-accepted, tend to have less comprehensive distribution records than those that have been known and accepted for decades.
History of synonymies. Some accepted species have been plagued with multiple names throughout their history. This has created difficulties for fieldworkers attempting to associate a field species with one synonym or another. In general we have dealt with this problem by assessing records and relevant images against our known understanding of the species. If the correct accepted species could not be allocated, the record has been excluded or listed as doubtful/uncertain. For this reason synonymies have only a small influence on our data reliability.
Note that although the Taxon Finder tool assists in associating the nominal species name of an original description with its valid name, this is altogether different from allocating a recorded name to the distribution record of that species. In the latter case, the original field record must be confirmed as the intended species.
Field and identification issues
Inevitably, the reliability of field identifications is strongly influenced by taxonomic issues but there are also additional biases for a field researcher which can be independent of the taxonomist’s ability to separate one species from another.
Abundance
The effects of abundance are two-fold. Firstly, when time is limited common species are more likely to be encountered than rare species and will thus be recorded more often.
More importantly for us is the fact that common species are better known. This can pose particular problems when there are lesser known sister species present because the tendency is to record the better known sibling. Over the next few years we will endeavour to provide specific guidance about the species involved in order to improve the detection of the rarer species.
These two effects both lead to a tendency for rarer species to be under-recorded.
Depth, habitat and regional variability of the species
Environment-correlated variations which are known to an experienced field worker may appear to be very different entities to a less experienced one. Sometimes this is exacerbated by access to identification images of only one or two ecomorphs such that other morphs are not recognised or are recorded as something different.
Additional differences in form, be they habitat-correlated or inter-regional, are dictated by genetics, with large inter-specific differences in the degree of morphological ‘plasticity’. Again, Diploastrea heliopora provides a good example of one extreme, with little difference in form across its broad habitat range or, in fact, its entire Indo-Pacific distribution. By contrast Pavona cactus has a number of morphotypes with a clear genetic basis (Willis and Ayre, 1985) while many species of Acropora, and indeed other taxa, exhibit a wide range of forms dictated by local environmental conditions, notably wave energy, light and sediment load. Conversely, and providing an additional challenge, are the increasing number of cryptic and ‘sister’ species being discovered.
New species aside, ecological variants are unlikely to have much influence on our analyses because at ecoregion scales one or more of the recognisable ecomorphs are likely to have been recorded. They may have the greatest influence where little work has been done and lesser known morphs are prevalent but go unrecognised for what they are. We will progressively add additional location and habitat-specific images to species in these categories to improve discrimination of variants. Users are encouraged to contribute images for inclusion in this website if they believe they would be useful to others.
Cryptic species
Species that are cryptic can be overlooked and may be under-recorded. Crypsis may be due to size (small species being more likely to be overlooked than large), habitat (such as under overhangs) or similarity to other species. Genetically distinct but morphologically similar crypsis is increasingly being suggested by molecular work and will be a particular challenge for field studies of the future.
Accessibility of habitat
Species that normally reside in habitats that are inaccessible or rarely visited may be under-recorded. This includes mesophotic species, especially those for which greater depths are the preferred habitat such as several species of Leptoseris. It also includes species which are normally found in inter-reefal areas such as species of Heteropsammia and Diaseris. Species occurring in highly turbid or turbulent waters, or those restricted to very protected habitats, may also be under-recorded although again this is less likely at ecoregion scales. A pertinent example illustrating several distributional issues is Craterastrea levis. This little-known species was previously synonymized incorrectly with Leptoseris foliosa. It occurs in mesophotic habitats, typically on relatively inaccessible deep reef slopes, but occasionally on shallower turbid slopes, and was considered endemic to the Red Sea and western Indian Ocean before its discovery in Eastern Indonesia by the present authors in 2006.
Observer bias
Due to the difficulties of coral identification and the long apprenticeship required to become competent across all groups, most observers have biases towards certain taxa, a suite of species, or to certain habitats or regions. In particular, more experienced observers tend to identify and record many more species. As far as possible resulting uncertainties have been absorbed by appropriate allocation to the data categories below.
Extreme morphological variants, hybrids and new species
Unless working in species-poor or highly familiar regions, even the most experienced field observers encounter colonies in situ that are difficult to identify. They may go unrecognised because of lack of experience of the variability of a species, or they may be unknown variants of a known species, or a so-called ‘hybrid’, or a species new to science. When these are encountered during surveys which are not for taxonomic or diversity purposes, they are likely to be ignored or merely noted in passing, creating a bias against discrimination of rare or undescribed species.
Even when such surveys are for taxonomic purposes, and the specimen(s) turns out to be a probable new species, that species may not reach the public arena for many years. For example, we have at least 50 apparently unnamed species which we have studied but which are not yet included on this website either because of time and opportunity, or because relevant type specimens need to be re-examined. Added to this are the aforementioned cryptic species revealed by molecular studies.
Unnamed species such as these, that do not meet our criteria for being 'valid' or 'probably valid' are not currently 'accepted' on this website and do not have Species factsheets. However, they will affect future diversity estimates. It is our intention to add unnamed species for which we have sufficient evidence to provide taxonomic justification and which have descriptions, images, and locality data. But for the present, the statistics we provide refer to valid and probably valid species only.
Ecoregion scale issues
There are a number of ecoregion-related biases which affect coral distribution data.
Ecoregion boundaries, size and habitat diversity
It was necessary, for the reasons noted above, to use an ecoregional approach to species distributions. As far as possible, ecoregions are delineated on the basis of their internal coherence and external distinction from surrounding ecoregions. They also divide the oceans into units which are relevant to our present aims of documenting diversity and distributions (see Ecoregions below).
Boundaries are based on the best information available, both published and unpublished, but have different levels of support and clearly the precise position of a boundary can influence recorded species richness. On the whole this is dealt with through strongly predicted records.
Neighbouring ecoregions, and those further afield, are biologically connected to greater or lesser degree via oceanographic dispersal, an important consideration in respect of boundaries, and one that will be revisited with future research.
Ecoregion size, on the other hand, is a more difficult potential bias to accommodate. Certain smaller ecoregions are designated because they are relatively isolated, or because they harbour different habitats, or are subject to particular environmental regimes. However, the mere fact that they are smaller tends also to influence their range of habitat diversity with consequent implications for species richness. And for isolated ecoregions, predictions are far more challenging due to the erratic nature of successful colonisation. Such ecoregions, if they have not been the subject of detailed studies, are likely to have under-estimated species richness.
Most ecoregions encompass a diverse suite of habitats (for example those of the Coral Triangle) but some can be relatively unvaried (such as a chain of atolls or line of fringing reefs). In general, the more habitat types an ecoregion has in a particular biogeographic province the more likely it is to harbour a larger suite of species relative to its neighbours.
Accessibility
Ecoregions that are inaccessible due to politics or remoteness may be under-represented in our species distribution data. These become particularly important where they are at the boundaries of a species distribution range. This has special bearing in some of the Pacific ecoregions where local variants are already difficult to attribute to valid species and we have insufficient information from other sources to predict whether a species is present or not. It is likely that these outlying ecoregions harbour more species than current distribution data suggest.
Sampling effort
A reasonable assessment of species diversity within an ecoregion requires sampling across depth zones in a single habitat type and in all habitat types within the ecoregion. Observer expertise must also be high enough to distinguish all species encountered. If any one of these three criteria is not met, the ecoregion diversity is likely to be under-estimated. There is a strong relationship between sampling effort and recorded diversity. The actual numbers associated with such curves vary according to habitat diversity, geographic position, and the characters of the ecoregion.
Another important consideration is methodology. Quantitative methods, including transects and quadrats, typically sample very small areas, and thus record fewer species than ‘roving diver’ type surveys with active searching for species.
The form of sampling undertaken in each ecoregion varies. In some cases it has been comprehensive with 50-100 or more individual sites studied across all habitat types with highly skilled observers. In other cases, many studies may have been undertaken but sampling has been of common or easily recognisable species only. In others, records are limited to museum records, images, or unverifiable species lists.
As far as possible, and where it is warranted, predictions have been made for species occurrences in poorly known ecoregions but this bias still exists in our data and particularly affects rare species and those which are more difficult to identify. The method we use for predicting a particular species occurrence (see above) is based on its confirmed distribution range in neighbouring ecoregions, its global distribution range, its biology, and known habitat preferences as compared with those of the ecoregion in question. The number of predicted species varies widely among ecoregions.
Overall ecoregion robustness with respect to distribution data
The various data qualifications described above have been summarised into a robustness value to give some insight into the data reliability of different ecoregions. Ecoregion robustness will shortly be available as a map layer which can be switched on through the layer menu on any Factsheet or Coral Geographic map.
Inter-ecoregional comparisons of diversity
Following on from many of the above discussion points, users are advised not to place too much weight on precise numbers or the fact that one ecoregion has a slightly higher or lower diversity than another. This particularly applies to the Coral Triangle where many species are yet to be described or even discovered. Such numbers are still in a state of flux and are likely to change for many years.
Time issues
Species distribution data are currently presented as if all species that are confirmed or strongly predicted could be found in the ecoregion now and for most species and ecoregions this is likely to be true. Most data are from the past 40 years, and in particular the past 15 years, but the full dataset spans a time period of over a century. Where ecoregions are remote and have not been visited for long periods, species complements may have changed, especially with the onset of widespread, repeated episodes of coral bleaching since the 1980s. Even in well-studied ecoregions where surveys have taken place in the recent past, the escalating rate of severe bleaching and other disturbances may have had impacts on diversity that are not yet recorded. For this reason future new records will be date stamped and tools to facilitate reliable indication of change are being developed.
Issues inherent in the data
As discussed under Distribution data categories, records that are coded as doubtful or uncertain, and all ‘no record’ data points have a variety of potential meanings. Feedback and further studies will reduce the impact of false negatives in the data. In the meantime, the ecoregion and species robustness categories provide some insight into their effect on individual species records.
Errors and omissions
We have endeavoured to reduce errors and omissions to a minimum, but it is inevitable when dealing with such large datasets, that some will persist. We welcome feedback.
Distribution data categories
Distribution data coding
Species distribution data are coded as confirmed, strongly predicted, doubtful, or no record as follows:
a) Confirmed records are those for which we have assessed available records and are satisfied that one or more of those records for the species in the given ecoregion is confirmed as being the species in question.
b) Strongly predicted records fall into two major categories.
(i) Where one or more records have not been confirmed conclusively, but on balance the evidence is strongly in favour.
(ii) Where there are no records or records are considered insufficiently reliable to meet (a) or (b)(i) but the ecoregion
• is surrounded by or in the direct current path of neighbours which have confirmed records of the species; and
• has suitable habitat to support the species; and
• there are no other known criteria that might exclude the presence of the species
Note that a species distribution would not normally be given strongly predicted status on the basis of neighbours (rather than a record that has not yet been confirmed but seems likely) if the ecoregion is at the species distribution boundary.
c) Doubtful or uncertain records fall into the following groups:
• the record has been published but there is insufficient supporting information to confirm or predict its presence and there are reasons why it may be another species. Further confirmation is required
• the record has been published but we consider it likely to belong to another species
• the record is unlikely to be correct, usually because it is geographically remote from all other occurrences. Further confirmation is required
• the record has an unknown origin and/or the species is difficult to distinguish from others and there is no other supporting information
Note that only published records are given uncertain or doubtful status. Lists of species that are unpublished and unverified or which have vague or unknown authors (for example websites with lists of species from local reefs) are not included.
d) No record. This category covers a number of possibilities:
• The species is genuinely absent. It is impossible to be certain, just as it is impossible to declare a species extinct. For most ecoregions, ‘absent’ is a matter of likelihood rather than an absolute statement
• The ecoregion is poorly known and there are very limited records. In such cases, the species may be present, but we have no evidence one way or another and it is thus considered absent until there is evidence to the contrary
• The species may be listed somewhere but we are unable to verify any details and it is thus considered absent until there is further supporting evidence
• Presence of the species in neighbouring ecoregions makes its presence a possibility but this possibility does not meet the above criteria of being ‘strongly’ predicted
Recommended use of distribution data
The use of strongly predicted records
Species distribution maps within species factsheets are displayed with all four distribution categories showing (confirmed, strongly predicted, doubtful or uncertain, and no record).
However, for almost all purposes confirmed and strongly predicted records should be pooled and considered as present; and, doubtful or uncertain and no record should be pooled and considered as absent.
Coral Geographic queries draw on confirmed and strongly predicted records as if they were all ‘present’. This is because we believe that confirmed records on their own are a poorer reflection of reality than the combination. Although strongly predicted records are unconfirmed, fieldwork by us or others has repeatedly shown that (at ecoregion level) strongly predicted records when sought are generally found. Species distribution factsheets provide all levels of discrimination.
Ecoregions
Ecoregion delineation
In principle and as previously described, ecoregions are intended to be internally cohesive and externally distinct from their neighbours. Many, especially those of Japan, the Coral Triangle and Australia have a long history and generally meet these criteria, others are defined by geography and some are somewhat arbitrary reflecting environmental partitioning. We have not always been able to meet these criteria, for example the Gulf of Aden, the widely separated Mascarene Islands and the very isolated islands and island groups of the South Pacific are not internally cohesive. However, in such cases there are currently insufficient coral records to allow existing ecoregions to be meaningfully subdivided. On the other hand, the Indonesian Archipelago is highly subdivided, the reason being historical, pre-dating the comprehensive coral data now available. In general, future developments will involve subdividing, not amalgamating existing ecoregions.
A measure of the internal consistency of ecoregions and external distinctions from neighbouring ecoregions is given, for each ecoregion, in the relevant Ecoregion factsheets.
Change over time
Many studies, broadly summarised by Hoegh-Guldberg, Eakin, Hodgson et al. (2015), show that corals are in rapid decline and could face extinction by the end of this century (see Veron, 2008a). This has mostly been tracked by measured decline in coral cover although some studies are now targeting individual species in the Caribbean and some genera in parts of the Indo-Pacific. To address the effect of time and create a capacity for this website to track changes in all species on a global scale, the following steps have been taken or are planned:
- The website is versioned (see Versioning). Over time, as distributions are changed, the previous version will be date-stamped and archived and will be accessible to users for reference. Pages dedicated to records of change will likewise be dated and archived.
- The abundance maps currently planned are date stamped and the studies underpinning them are accurately georeferenced so that repeated surveys will yield direct measures of change (DeVantier and Turak, in prep.). Over time this is likely to be a uniquely valuable record. It is already showing that some surveys should now be repeated as they are likely to give a species-level measure of change since the original work was done.
- We will be actively soliciting anecdotal evidence of change and will provide information to assist researchers, divers and enthusiasts with local projects to support this work.
- Evidence of change will be made available on the website through map layers allowing this information to be widely accessible.